SPXS trade ideas


GFC vs. COVID-19Thoughts on more downturn is the liquidity fueled stimulus running on fumes; thought id compare the 08 crash and the current situation love to hear the thoughts on what happens from here

SPXS for brave soulsWheres the bear gang at. Feeling the market is overdue for a correction? here's your chance to buy cheap ass spxs. 3x short etf.
Strictly looking at chart. Trend still down. Last line of defense is where you buy and most likely get one profit target out. EASSSSYYYYY stop loss. R/R over 9

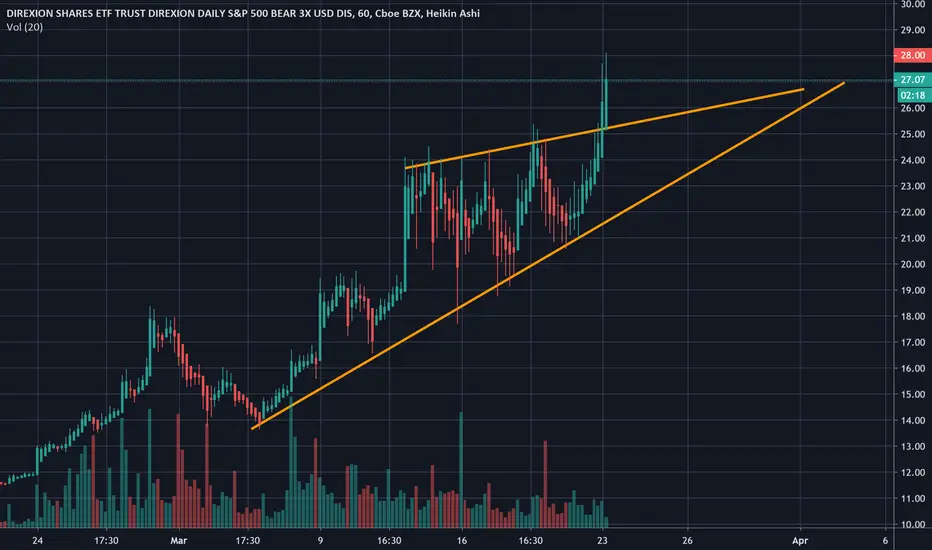
SPXS Breakout Soon?Trend lines show the slowed down movement coming to a wedge, potential breakout soon or we continue this steady decline.
Depending on which trend gets broken through we should know soon

SPXS Bear Chart - Potential Dump Scenario.Looking at the Fed pumping money into market however unemployment at ATH. This shouldnt last. Expecting a reversal as markets start to erode due to US economy on its death bed due to #stayathome orders.


SPXS week of 6 Apr 2020VWMV
Daily +/-2 SD (black arrows).
Weekly +/- 1-3 SD (black, red, green, yellow horizontals) with buy and sell zones (red/green).
Monthly +/-2 SD range (light yellow field).


SPXS 23-27 Mar 2020I utilize the weekly data to calculate the Volume Weighted high, and the Volume Weighted low. Then I use these figures independently to calculate the standard deviations. I'm experimenting with this method and theorizing it has multiple facets of usefulness. Of course identifying support and resistance areas is a benefit, but also seeing the variation in the SD's from week to week, how they increase or decrease in relation to their priors, and how the +2 and -2 expand and contract in response to increasing or decreasing volatility on the up or down side. I'll most likely add the +/-3SD to my charting soon. I've been using this method privately for some time and have only just recently begun posting it as earlier experiences with it have been surprisingly successful, and I'm curious about any additional tweaks the community may offer as advice.


WHAT SHOULD NOT BE IGNORED?IN THE LAST WEEK OF FEBRUARY WE SEE A DRAMATIC BETTING AGAINST MARKET AND VOLUME INCREASED 6 TIMES OF AVERAGE OF THE LAST 20 WEEKS.
I THINK MARKETS WILL BEHAVE LIKE ROLLERCOASTER UNTIL 2020 ELECTION BECAUSE WE HAVE CORPORATE TAX CUT ON ONE HAND AND INCREASE CORPORATE TAX ON THE OTHER HAND. FINALLY, THE CORONA VIRUS CAUSED MESS ALL AROUND THE WORLD.

SPXS – Bullish Banana Breakout Confirms SPY DowntrendChart Details
Weekly view shows price touching 10WeekMA. (same as SPY but inverse obviously)
Price cross above 10Week should confirm uptrend to gap fills.
Price above aqua blue line confirms uptrend to EMA cross.
Price above yellow line and look for upper gap fills.
Gaps to fill up to $17
Stop $13
Target $16
Money Patterns member alerts for this trade had lowest entry price of $12.08
Opinion – SPXS has very few unfilled gaps previously. Market overextended. This has good potential to fill gaps in the next few weeks.
Coronavirus fears and reality will sink in. First time in 50 years Americans are quarantined WITHOUT CHOICE when entering the country.
About Me
www.moneypatterns.com
Options Strategies, Video Technical Analysis, Instant Alerts, Specific Options Order Entry Details, Daily Updates, Equities & Crypto, Weekly Breakdowns, Charting Service, & More in Members Area!
Thank you for liking, commenting, throwing up a chart, following, or viewing.
I am not a financial advisor. My comments and reviews are based on what I do with my personal accounts and on www.moneypatterns.com

SPXS - SPY Hedge Bullish - Shakeout Before BlastoffChart Details
Small pullback today.
Bullish EMA cross and Bullish 10Week Cross stacked up. Very close to crossing will confirm bullish trend.
Gap fills to $15/$16 conservative estimate.
Weekly trend confirms bullish trend. RSI on Weekly confirms pattern breakout.
Stop $12.50
Target $15
About Me
www.moneypatterns.com
Options Strategies, Video Technical Analysis, Instant Alerts, Specific Options Order Entry Details, Daily Updates, Equities & Crypto, Weekly Breakdowns, Charting Service, & More in Members Area!
Thank you for liking, commenting, throwing up a chart, following, or viewing.
I am not a financial advisor. My comments and reviews are based on what I do with my personal accounts and on www.moneypatterns.com

SPXS – Hedge Against Downturn Turned BullishChart Details
Price on Daily broke out of banana pattern.
Bullish EMA cross on Daily should occur with Daily close over $12.81
Weekly trend very close to bullish flip. When this occurs, $14 conservative price target.
10WeekMA cross around $13.50 should continue to fill gap at $15.
Opinion
We are long overdue for a pullback. Coronavirus now in 4 countries. Hong Kong on lock-down.
Gold and Silver looking bullish as well.
Next week 1/27 is going to be the biggest week of earnings. BA, AAPL, MCD, etc.
If AAPL misses earnings, there will be repercussions due to market cap of the company and being overpriced.
About Me
www.moneypatterns.com
Options Strategies, Video Technical Analysis, Instant Alerts, Specific Options Order Entry Details, Daily Updates, Equities & Crypto, Weekly Breakdowns, Charting Service, & More in Members Area!
Thank you for liking, commenting, throwing up a chart, following, or viewing.
I am not a financial advisor. My comments and reviews are based on what I do with my personal accounts and on www.moneypatterns.com

SPXS – Bullish Breakout – Any Day Now… Trade Entry
Anything at $12.80 or below is a great entry price as hedge.
I am putting some wishful orders in the $12.34 area and below just in case.
Chart Details
Banana pattern almost at end. I think the last Daily Bullish candle gave us a better contact point with $12.59 low.
The current downtrend without significant uptrend has occurred over 3 months. Overdue.
Gaps to fill up to $17.40.
Bullish EMA Cross and price crossing 10WeekMA will confirm uptrend.
About Me
Thank you for liking, commenting, throwing up a chart, following, or viewing.
I am not a financial advisor. My comments and reviews are based on what I do with my personal accounts.
Website will be ready for launch mid-January 2020.
Disclosure - I am long BTCUSD, GBTC. Short term GDX Bullish, SPXS Bullish, MCD Bullish

SPXS - Banana Pattern Getting BullishTRADING ACTIVE
Options were closed when stops were hit.
Stock is kept as better entry. More resistant to market whipsaw (no time issue like options).
Chart Details
Banana/Shoe pattern is repeating.
We are at the end of current pattern. Expecting gap fills up to possibly $17+
Bullish EMA Cross (at $13.70) and Bullish 10WeekMA cross ($14.60). Over both we are confirmed Bullish. I would be watching exits as this moves quick.
Fractal shown is from similar pattern where Daily candle had topping tail wick, followed by larger green Daily candle on next day.
This indicates the turn to me.
Entry Options
I would continue to add in this position under $12.90 if we get into end of pattern. Otherwise I am waiting with current position.
Stop loss at $12.70 – although I will probably hold past this. SPXS will pop and cover up-gaps.
Side-note - GDX and Gold are both turning bullish which (to me) is a secondary confirmation of incoming market correction/pullback.
News: - I haven't watched either but RealVision is excellent with sources.
1/1/2020 - John Bollinger Interview (Debunking False Assumptions) www.youtube.com
1/2/2020 - RealVision Finance "WTF is going on in the economy" www.youtube.com
About Me
Thank you for liking, commenting, throwing up a chart, following, or viewing.
I am not a financial advisor. My comments and reviews are based on what I do with my personal accounts.
I am transitioning to my new website www.moneypatterns.com and have updated my name previously jbird7839. Same guy - new name. :)
Website will be ready for launch mid-January 2020. Thank you for your patience while I try to juggle everything and maintain the same standards.
Disclosure - I am long BTCUSD, GBTC. Short term GDX Bullish, SPXS Bullish

SPXS – Few Days Chop Before Bullish BreakoutTrading active in SPXS. Entry at $13.10 or less is great entry for 1 month hold max.
Trade Entry
I recommend using Dollar Cost Averaging to scatter orders under the $13.10 mark.
Chart Details
SPXS fractal holding from previous chart.
Fractal shows we will have few days chop sideways before pattern breakout.
Last fractal did not fill pattern, so I expect we do not get down into the $12.75 area.
Many gaps to fill going up to $17.
Price break of 13.66 confirms EMA bullish cross.
Price break of $14.31 confirms SPY should start pullback/correction.
About Me
Thank you for liking, commenting, throwing up a chart, following, or viewing.
I am not a financial advisor. My comments and reviews are based on what I do with my personal accounts.
Website will be ready for launch mid-January 2020. Thank you for your patience while I try to juggle everything and maintain the same standards.
Disclosure - I am long BTCUSD, GBTC. Short term GDX Bullish, SPXS Bullish, CRWD Bullish short term.
Previous SPXS Chart

SPXS - Bullish Confirmation on Daily YesterdayTRADING ACTIVE IN SPXS
Chart Details
SPXS confirmed Buy Signal on Daily yesterday.
Gaps to fill up to $17.50.
Bullish EMA cross will occur around $13.94.
10WeekMA cross around $14.60.
Anything above $14.60 should confirm Bullish trend up to gap fills.
Price may stop at each gap fill – watch to exit if reversal occurs.
RSI turned Bullish.
Trend Dots confirm Bullish trend on Daily. I will update if Weekly view also confirms.
Entry Options
I am entered in the Jan 17. Expiry, 12/17 Put Credit Spread. $3.83 Credit received. Breakeven SPXS at $13.17. Max loss $117. Max gain $3.83
About Me
Thank you for liking, commenting, throwing up a chart, following, or viewing.
I am not a financial advisor. My comments and reviews are based on what I do with my personal accounts.
I am transitioning to my new website www.moneypatterns.com and will be updating my username here. Same guy - new name. :)
Website will be ready for launch mid-January 2020. Thank you for your patience while I try to juggle everything and maintain the same standards.
Disclosure - I am long BTCUSD, GBTC.
Short term - GDX Bullish, SPXS Bullish, SMH Bearish
