Key stats
About ProShares Ultra 7-10 Year Treasury
Expense ratio
0.95%
Home page
Inception date
Jan 19, 2010
UST is a leveraged play on the intermediate portion of the US Treasury yield curve, providing (2x) exposure to the daily returns of an index of US Treasury securities with 7 to 10 year years remaining in maturity. Targeting this pocket gives UST significant interest rate sensitivity, and sets it apart from the many funds that target 1 to 10 year Treasury securities. As a geared product with daily reset, UST is not a buy-and-hold investment, and should not be expected to provide index leverage return greater than one day period. That also means that trading costs matter much more here than fees, and on this front UST could have some vulnerabilities. Investors should pay close attention to its daily trading characteristics to determine if it has enough liquidity to support same-day entry and exit. Prior to October 14, 2016, UST tracked Bloomberg Barclays U.S. 7-10 Year Treasury Bond Index. The change has minimal impact on investors' exposure.
Classification
What's in the fund
Exposure type
Cash
Government
Bonds, Cash & Other100.00%
Cash81.24%
Government18.76%

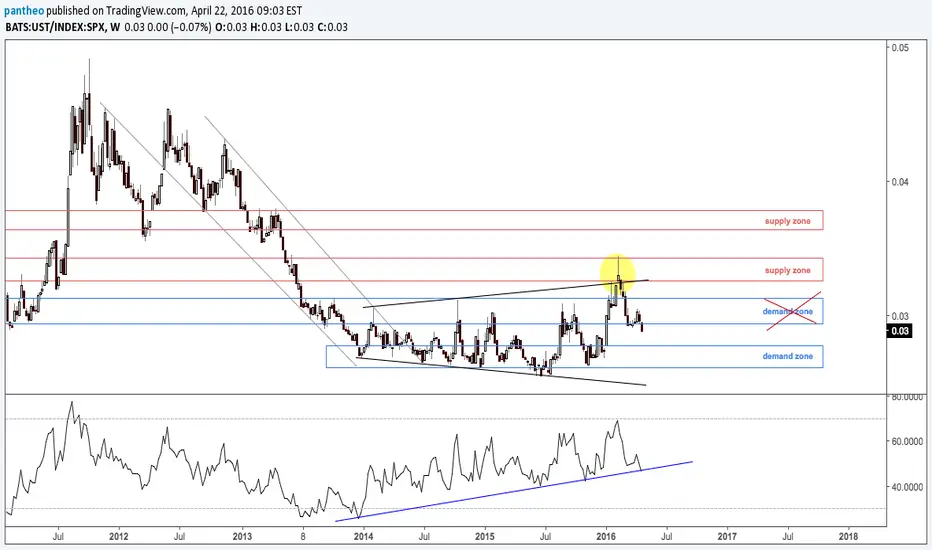

UST/SPX:BONDS/STOCKS RATIO BREAKING OUT?Price kept coming down inside this down trending channel for the last two years.
1,618 area gave two long entries, first being the most successful so far and second being the most safe and low risk due to double bottom and bullish divergence at the end of March.
Major obstacle now, after broke the
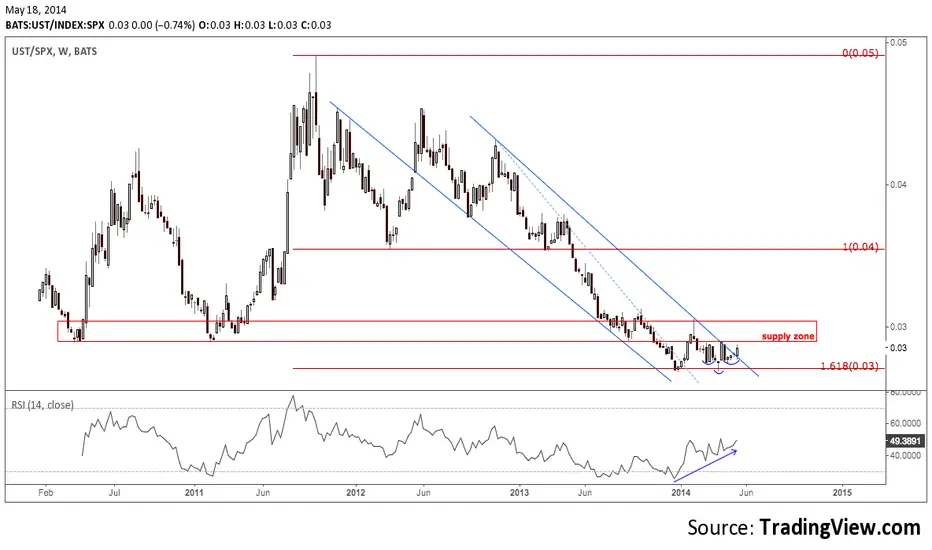
Possible double bottom at 1,618 for bonds/stocks ratioPrice has been contained in the downtrending channel for a couple of years now.
Possible double bottom at 1,618 fib, looks like Adam and Eve, but measuring the the distance from left (A) and right edge (C) to middle peak of Feb 2nd bar (B) can be Eve & Eve at the end, which has better success rate.

See all ideas
Displays a symbol's price movements over previous years to identify recurring trends.