Looking for XLC retraceCommunication 618 tap.
Will heavily depend on rest of equities obviously. Needs to break through 382 resistance.
XLC trade ideas

XLCI think we are at a key support level. I want to see bullish candles in this zone for a retracement to previous high. Oversold as well. Will this fire burn out soon?
More specific details in photo!

xlc1.EMA's crossing up soon?
2. Price currently oversold?
3. Price bouncing off support?
4.Can price break through top dotted line?
5.If price breaks bottom dotted line, new support can be searched for? (Average down?)


XLC vs SPYTeleCommunications vs SPY.. sector that includes Facebook, Disney and Netflix. As long as price remains above my marked line, im bullish.

I rarely trade Canadian stocksTheres could some potential for CGX here. Seems to be matching the patterns for XLC and AMC. They're all running flat Elliott correction waves. Could also be a seasonality effect summer is approaching more people want to go out, movie theatres are slightly increasing capacity.

Pleaseee Pick Me UP Before you go to the moonPleaseee Pick Me UP Before you go to the moon
must get LTF Confirmation to enter

XLC Digestion of GainsConsolidation near all-time highs is a bullish characteristic and we are seeing that in XLC. Keeping this on watch and want to be long above 68


Market Rotation Into Energy (XLE) The past week there was rotation into Energy (XLE). There is precedent for rotations into energy marking tops and continuing as safe havens during corrections.
In the bottom chart, you see the rotation happening in September 2018, just before three months of market declines (21% on S%P 500 and 24% for Nasdaq).
Looking back further to the 2000 tech bubble, look at stocks like CVX, XOM and SLB. These stocks are going up or sideways while the market is crashing around them.
On the other hand, 2018 these stocks fell along with the market.
So the question is are we in a correction?
If so, is it more like 2000 or 2018?
Have energy stocks been held down while the tech bubble grew?
Will we see energy stocks climb over the next few months?

Sector Winners and Losers the Past WeekHere are the sector winners and losers the past week. XLB (Materials) wins out, gaining 1% compared to the other SPDR ETFs combined. XLC (Communications), XLK (Technology) and XLE (Energy) at the bottom.
Breaking out XLB into it's top performing stocks for the week, you can see which ones carried the weight of the moves including EMN, LYB and CF. All of these will be worth watching over the next few weeks.

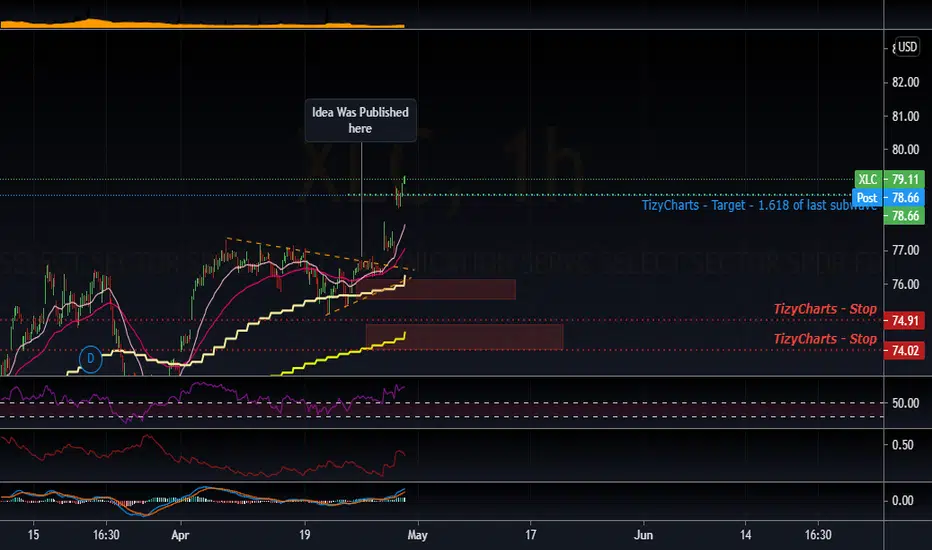
XLCTrying break above the 1.618 extension. If it can hold above the 1.618 level, the next target is around $74

Industrials (XLI) win this week led by Fedex and UPS Industrials win this week with tech coming in last. Fedex is up 13% this week and UPS is up almost 30% over the last few weeks thanks to the politics around USPS.

V Cup and HandleTop 10 Holdings
FB - Facebook Inc A21.56%
GOOGL - Alphabet Inc A11.44%
GOOG - Alphabet Inc Class C11.12%
TMUS - T-Mobile US Inc6.48%
NFLX - Netflix Inc4.79%
ATVI - Activision Blizzard Inc4.66%
T - AT&T Inc4.37%
CMCSA - Comcast Corp Class A4.35%
EA - Electronic Arts Inc4.31%
CHTR - Charter Communications Inc A4.30%

XLC - Communications BreakoutAfter consolidating, communications breaking out higher from flag formation as WFH continues to push this sector higher app.optionsplay.com

Study of Sector Rotation During 2020 Market CrashFor Growth Investors, there were a few shocking days over the past months where the indexes went up but our portfolios went sideways or down. There's no worse feeling than having the market go up and have your portfolio go down.
The cause was sector rotations as investors moved into "discounted" stocks that were hit the worst during the market crash of 2020 and hopes were they would recover sharply. This chart is a visual history of the last several months and confirmation of the rotations occurrences.
I'm using Select Sector SPDR ETFs: XLK, XLY, XLV, XLC, XLB, XLP, XLRE, XLU, XLI, XLF, XLE. The base chart is a composite price index of all the ETFs listed. The other lines are % change comparison of each ETF starting just before the market made all-time highs and then turning downward.
Please post in the comments if you see other insights in the chart.
Here's hoping for a continued recovery and a safer world over the rest of 2020.

XLC 5 wave completion (New -ve Delta Butterfly Spread ) XLC is dancing on the edge of a potential decline with significant resistance and a potential double top into the 57.62 level. We are considering this entire 5 wave impulse as complete with a potential (A), (B), (C) decline. Looking to place a 60/49/47 Put Debit Butterfly expiring Aug 21st with debit no more than 3.60

Communication Services are Tech And They're Breaking Out Vs SPXAfter showing considerable strength during the selloff Communication Services are resolving higher from a ~2yr base relative to the S&P 500... $XLC / $SPY
Might have something to do w/ the fact 60% of holdings are from the Internet & Software Services industry... $GOOGL $FB $NFLX $IGV $XLK

EPISODE 10/11: US COMMUNICATIONS-CUP & HANDLE TARGETS TA(XLC)Episode 10/11 : US (SPX) Sectors Technical Analysis Series - 31st of July 2019
Brief Explanation of the chart(since everything is labelled on there): (30 seconds read)
First and foremost : Similarly to the XLRE Index, the XLC was formed even more recently(2018), so obviously due to the lack of data this analysis should be seen at most as informative . In addition, I am not as interested in this particular sector. That doesn't take away from the objective of holistically analysing the whole market in the greatest of details. Now- time to break down the chart based on the current data:
XLC chart shows a very distinctive Cup & Handle pattern . Breaking above the purple square , will result in a bullish confirmation ; targeting #1: 55$ and later on 60$ as Target #2 .
Furthermore, the structural supports have been labelled. Although due to the lack of data, they will mostly depend on the negative momentum and very little on the currently labelled squares. Likewise as in the previous EPISODES , the same conditional events(trade deals/elections) apply to this sector. This concludes the technical analysis on the US communications(XLC) sector.
This is just a brief "free" and very detailed analysis. Perhaps in the future I might form a premium group, to whose members I will provide all the details of my research.
>>I do not share my ideas for the likes or the views. This channel is only dedicated to well informed research and other noteworthy and interesting market stories.>>
However, if you'd like to support me and get informed in the greatest of details, every thumbs up or follow is greatly appreciated !
Step_Ahead_ofthemarket-
Previous episodes on the US Sectors :
EPISODE 9 : US REAL ESTATE ( XLRE )
EPISODE 8 : US CONSUMER STAPLES ( XLP )
Full Disclosure: This is just an opinion, you decide what to do with your own money. For any further references- contact me through any of my channels.


5% Bounce Incoming: XLCAs you might know, I love my divergences. I think it is one of the easiest ways to spot reversals without lag (i.e. Basically every other indicator will tell you to get in after the reversal occurs. A divergence will get you in before it happens). The only caveat is sometimes it takes multiple drops before the reversal occurs. This means that divergences are great dollar cost averaging tools.
AMEX:XLC looks to be in a potential reversal situation. I am seeing a bullish divergence along with the low/crossing stochastic. I think that it will push it up about 5% before we see a continued bearish divergence on top. I would consider this a short term opportunity.
Again, I would suggest using dollar cost averaging when conducting a trade like this one. It is possible for the price to drop lower and the bullish divergence to continue.
