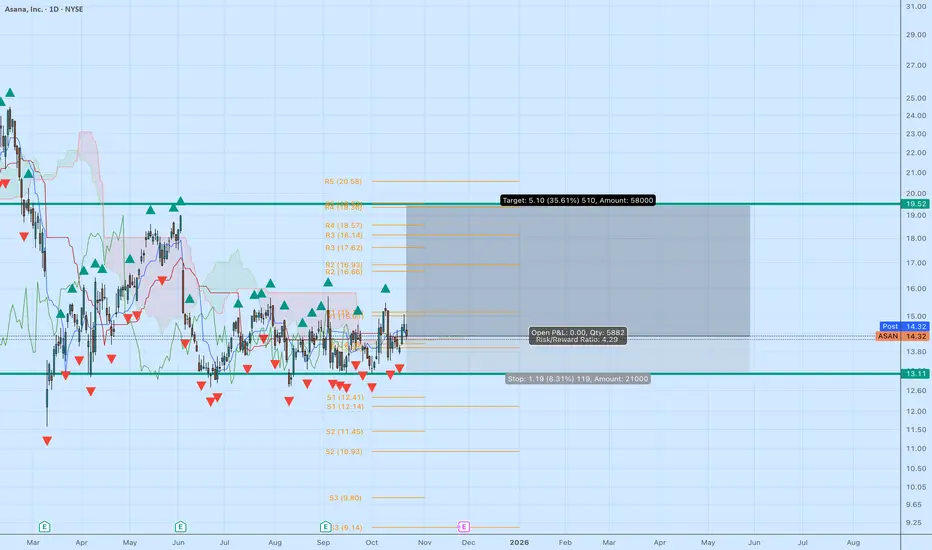
It's a time for ASANA. 40% potential profit - 18.10 USDThe stock price of Asana Inc. (ASAN) has been trading sideways between $12.80 and $14.00 after an extended downtrend that began in mid-2024. Currently, the price is holding near a key technical support level around $12.80, which previously acted as a reversal zone. This consolidation suggests a poss
Asana, Inc.
No trades
Next report date
—
Report period
—
EPS estimate
—
Revenue estimate
—
−0.93 USD
−255.54 M USD
723.88 M USD
86.07 M
About Asana, Inc.
Sector
Industry
CEO
Dan Rogers
Website
Headquarters
San Francisco
Founded
2008
IPO date
Sep 30, 2020
Identifiers
3
ISIN US04342Y1047
Asana, Inc. engages in the business of developing a work management platform that helps organizations orchestrate work from daily tasks to cross-functional strategic initiatives. The company was founded by Dustin Moskovitz and Justin Michael Rosenstein on December 16, 2008 and is headquartered in San Francisco, CA.
Related stocks

ASANA – Breakout Watch from Base | IchimokuDescription:
Asana (ASAN) is consolidating tightly around $14.30, coiling beneath key resistance and showing early signs of a potential breakout. Price is now sitting right at the Kijun and Tenkan cross zone, with the Ichimoku Cloud flattening and narrowing — a setup that often precedes trend expan
trade $ASAN with common shares• Price Action: ASAN is consolidating near the $14–15 zone, with prior support at $14.28 holding. The weekly candle shows a small bullish reversal, but momentum indicators (TSI, Volume-TSI) remain negative.
• Volatility: its ATR and relative volume standard deviation suggest potential for expansion,

ASAN Earnings Bull Play --Call \$14.50 Setup
## 🚀 ASAN Earnings Bull Play 🎯 | Call \$14.50 Setup (Sep 5 Expiry)
### 📊 Quick Summary
* **Beat History:** ✅ 8/8 beats with big surprises → strongest bull datapoint.
* **Fundamentals:** 89% gross margin 💎 but still unprofitable (–31% net).
* **Options Flow:** Put-heavy at \$13–13.50 (hedging), b

$ASANUpdated short and long term.
Expecting $15 in the next few weeks. Big positive gamma there, high volume shelf plus aligned with the Head and shoulders and looking like a wave 3 of wave 3 starting.
Zoom out for big picture.

$ASAN looking for a swing to range highOn the day I'm writing this, NYSE:ASAN (3b mc) just announced a new CEO after hours. His name is Dan Rogers, an SAAS veteran, previously holding executive positions of companies like ServiceNow (208b mc), NYSE:RBRK (17.5b), and LaunchDarkly (3b, private) during key growth phases.
73% of Fortun

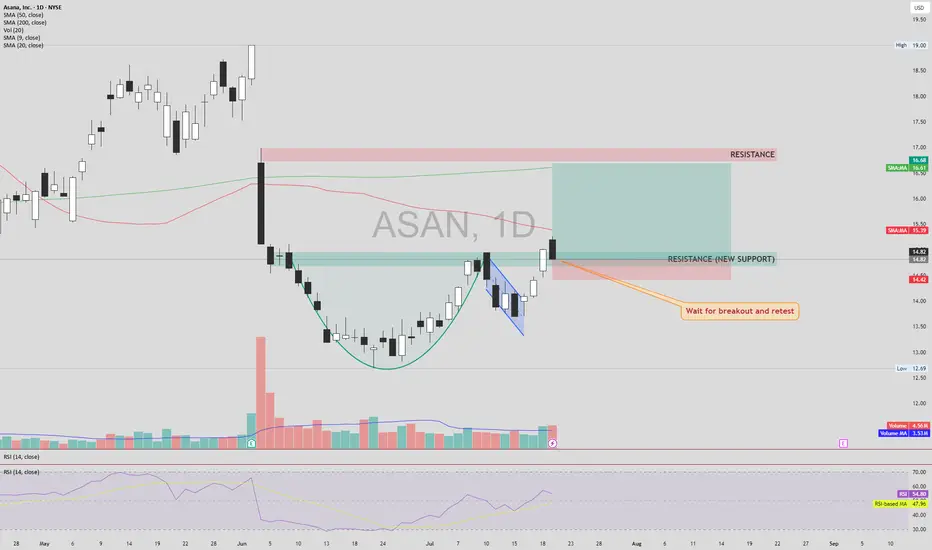
ASAN – Cup & Handle Breakout SetupASAN NYSE:ASAN has formed a classic Cup & Handle pattern and has broken above the neckline, turning previous resistance into new support. However, the price is still trading below both the 50 and 200 SMAs, which calls for cautious confirmation.
📌 Entry: Wait for a confirmed retest of the br
ASAN is bullish for the next few weeks first target 18–20$ASAN is bullish for the next few weeks
Following my analysis, there is a strong probability that the stock will rise, although it's too risky to return to the market before the signal confirming the return of liquidity to the markets.
first target = 18 – 20$

Long Trade Setup Breakdown for Asana, Inc. (ASAN) - 30-Min !📊
🔹 Asset: Asana, Inc. (ASAN)
🔹 Timeframe: 30-Min Chart
🔹 Setup Type: Bullish Breakout from Descending Triangle
🚀 Trade Plan (Long Position):
✅ Entry Zone: $22.89 (Breakout Confirmation)
✅ Stop-Loss (SL): $21.85 (Below Support)
🎯 Take Profit Targets (Long Trade):
📌 TP1: $24.05 (First Resistance)

Asana, Inc (ASAN) SL-$22,06 TP-$24,83Technical Analysis:
Accumulation with compression in a vertical trend
Breakout gap
Additional Note:
In a market with so many gaps, gaps are not as effective, but considering the context, I believe this is an opportunity not to be overlooked.

See all ideas
Summarizing what the indicators are suggesting.
Neutral
SellBuy
Strong sellStrong buy
Strong sellSellNeutralBuyStrong buy
Neutral
SellBuy
Strong sellStrong buy
Strong sellSellNeutralBuyStrong buy
Neutral
SellBuy
Strong sellStrong buy
Strong sellSellNeutralBuyStrong buy
An aggregate view of professional's ratings.
Neutral
SellBuy
Strong sellStrong buy
Strong sellSellNeutralBuyStrong buy
Neutral
SellBuy
Strong sellStrong buy
Strong sellSellNeutralBuyStrong buy
Neutral
SellBuy
Strong sellStrong buy
Strong sellSellNeutralBuyStrong buy
Displays a symbol's price movements over previous years to identify recurring trends.
Frequently Asked Questions
The current price of ASAN is 10.41 USD — it has decreased by −0.36% in the past 24 hours. Watch Asana, Inc. stock price performance more closely on the chart.
Depending on the exchange, the stock ticker may vary. For instance, on NYSE exchange Asana, Inc. stocks are traded under the ticker ASAN.
ASAN stock has risen by 3.45% compared to the previous week, the month change is a −19.20% fall, over the last year Asana, Inc. has showed a −52.68% decrease.
We've gathered analysts' opinions on Asana, Inc. future price: according to them, ASAN price has a max estimate of 22.00 USD and a min estimate of 10.00 USD. Watch ASAN chart and read a more detailed Asana, Inc. stock forecast: see what analysts think of Asana, Inc. and suggest that you do with its stocks.
ASAN reached its all-time high on Nov 15, 2021 with the price of 145.79 USD, and its all-time low was 10.59 USD and was reached on Jan 20, 2026. View more price dynamics on ASAN chart.
See other stocks reaching their highest and lowest prices.
See other stocks reaching their highest and lowest prices.
ASAN stock is 8.71% volatile and has beta coefficient of 1.26. Track Asana, Inc. stock price on the chart and check out the list of the most volatile stocks — is Asana, Inc. there?
Today Asana, Inc. has the market capitalization of 2.63 B, it has decreased by −0.45% over the last week.
Yes, you can track Asana, Inc. financials in yearly and quarterly reports right on TradingView.
Asana, Inc. is going to release the next earnings report on Mar 11, 2026. Keep track of upcoming events with our Earnings Calendar.
ASAN earnings for the last quarter are 0.07 USD per share, whereas the estimation was 0.06 USD resulting in a 12.90% surprise. The estimated earnings for the next quarter are 0.07 USD per share. See more details about Asana, Inc. earnings.
Asana, Inc. revenue for the last quarter amounts to 201.03 M USD, despite the estimated figure of 198.80 M USD. In the next quarter, revenue is expected to reach 205.14 M USD.
ASAN net income for the last quarter is −68.43 M USD, while the quarter before that showed −48.36 M USD of net income which accounts for −41.51% change. Track more Asana, Inc. financial stats to get the full picture.
No, ASAN doesn't pay any dividends to its shareholders. But don't worry, we've prepared a list of high-dividend stocks for you.
As of Jan 30, 2026, the company has 1.82 K employees. See our rating of the largest employees — is Asana, Inc. on this list?
EBITDA measures a company's operating performance, its growth signifies an improvement in the efficiency of a company. Asana, Inc. EBITDA is −162.80 M USD, and current EBITDA margin is −32.98%. See more stats in Asana, Inc. financial statements.
Like other stocks, ASAN shares are traded on stock exchanges, e.g. Nasdaq, Nyse, Euronext, and the easiest way to buy them is through an online stock broker. To do this, you need to open an account and follow a broker's procedures, then start trading. You can trade Asana, Inc. stock right from TradingView charts — choose your broker and connect to your account.
Investing in stocks requires a comprehensive research: you should carefully study all the available data, e.g. company's financials, related news, and its technical analysis. So Asana, Inc. technincal analysis shows the strong sell today, and its 1 week rating is sell. Since market conditions are prone to changes, it's worth looking a bit further into the future — according to the 1 month rating Asana, Inc. stock shows the sell signal. See more of Asana, Inc. technicals for a more comprehensive analysis.
If you're still not sure, try looking for inspiration in our curated watchlists.
If you're still not sure, try looking for inspiration in our curated watchlists.