ASML: Technically Strong Uptrend Supported by Excellent QualityNASDAQ:ASML ASML continues to exhibit a strong and well-defined uptrend, characterized by higher highs and higher lows, with price action firmly trading above both the 20- and 50-day EMAs. The EMAs are aligned in an orderly bullish structure, reinforcing positive trend strength and increasing bulli
ASML Holding N.V.
No trades
Key facts today
Next report date
—
Report period
—
EPS estimate
—
Revenue estimate
—
28.44 USD
7.84 B USD
29.26 B USD
387.00 M
About ASML Holding NV
Sector
Industry
CEO
Christophe D. Fouquet
Website
Headquarters
Veldhoven
Founded
1984
Identifiers
2
ISINNL0010273215
ASML Holding NV engages in the development, production, marketing, sales, upgrading and servicing of advanced semiconductor equipment systems. It includes lithography, metrology and inspection systems. The company was founded on April 1, 1984 and is headquartered in Veldhoven, the Netherlands.
Related stocks

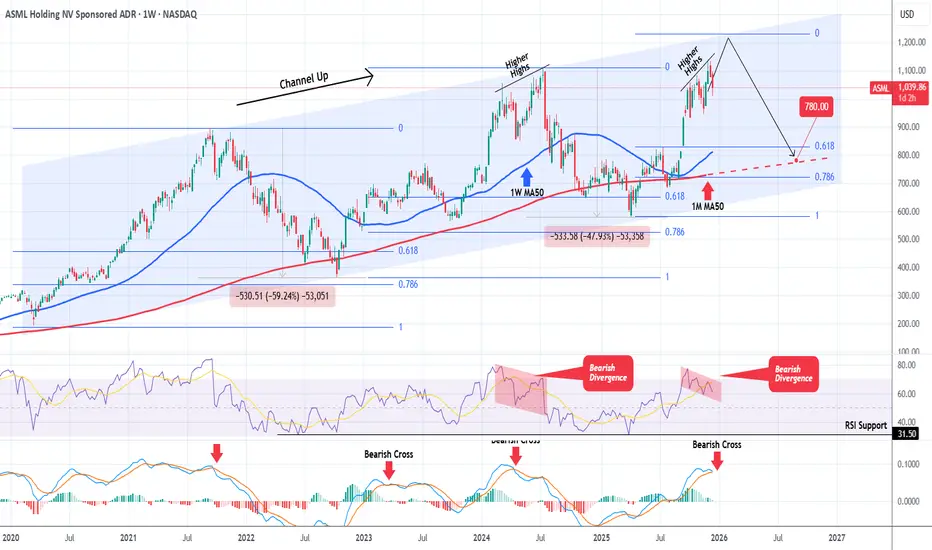
ASML is at or very close to its cyclical Top.ASML Holding (ASML) has been trading within a Channel Up since the March 2020 COVID Low and is currently approaching its Top. With the 1W RSI on a Bearish Divergence (Lower Highs against the price's Higher Highs) and the 1W MACD about to form a Bearish Cross, the stock doesn't have much room left to
EASY SHORT TO $1000Failed auction of the all time highs. local range support also lost.
$1000 or even $950 next.
Calculate Your Risk/Reward so you don't lose more than 1% of your account per trade.
Every day the charts provide new information. You have to adjust or get REKT.
Love it or hate it, hit that thumbs up

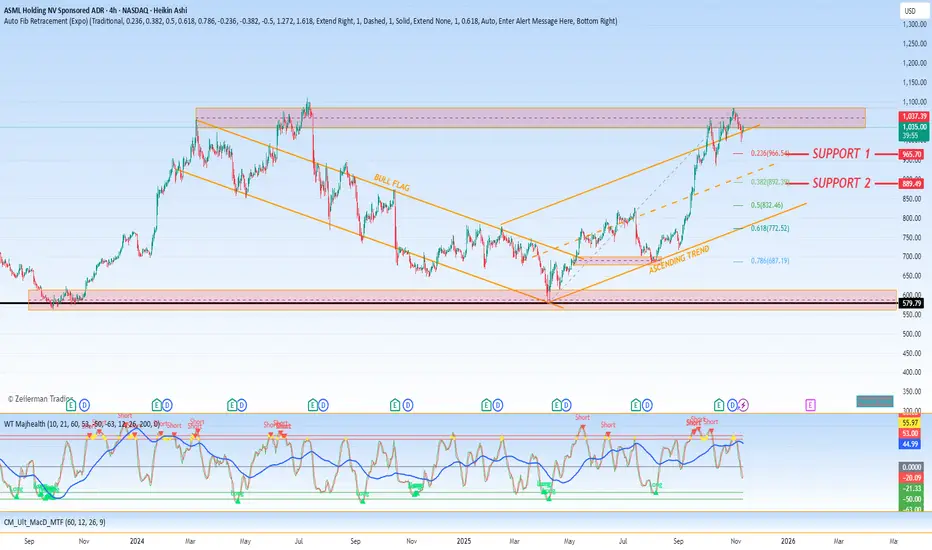
ASML IDEAWe are currently sitting above the next significant demand zone. The current consolidation I suspect will draw in a lot of early buyers which can be wiped out by another bearish leg that will land us in the demand zone that we can buy from.

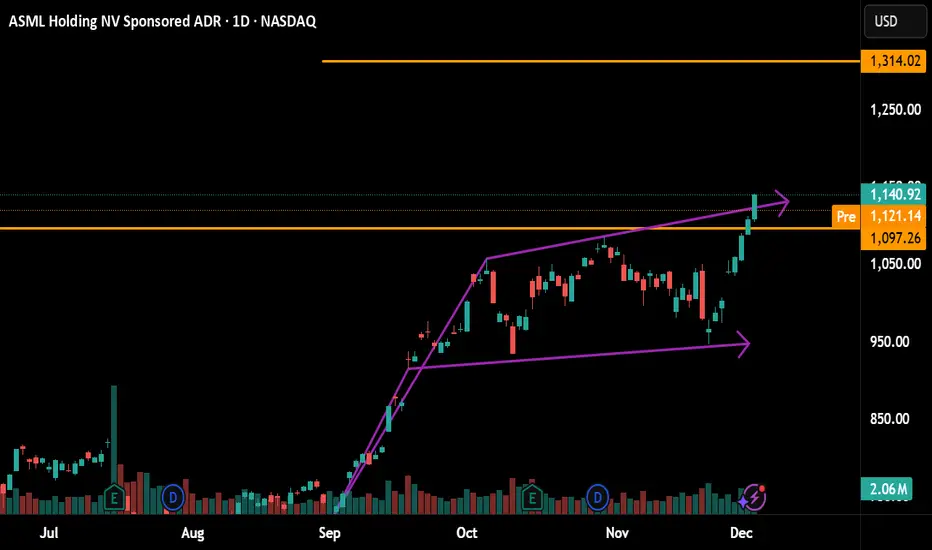
ASML : Flag Bullish Pattern activatedUpside Target 1314
cmp: 1140.92
SL: 929.
Risk Reward is not favorable so, decline is as strong opportunity 1000 around.
Manage Your Risk
Flag Bullish Pattern Breakout done
$ASML: Final Wave 5 Targets UnlockedNASDAQ:ASML has confirmed the end of the corrective Wave (4) on the daily chart and is powering through the initial phases of the final impulse move, Wave (5).
The price is currently challenging the key 0.5 Fibonacci level near $1,150, a critical resistance point. Sustained trading above this leve

$ASMLExecutive Summary:
ASML ( NASDAQ:ASML ) is exhibiting a compelling technical picture defined by a period of consolidation within a larger bullish structure. The chart has formed a clear Double Top pattern followed by a Double Bottom, signaling a battle between buyers and sellers that has now resolve
ASML, what are you trying to do?ASML is trading at interesting zone.
Two things could play out from here.
Concerning Points.
- PE stretched, median PE over the last 13 years has been 35.
- Has broken 10/20 day moving averages (daily).
- Several Gap up's on daily chart.
Positive points.
- AI play is still intact with strong dema
ASML Holding | ASML | Long at $680.00NASDAQ:ASML Holding, a developer and servicer of advanced semiconductor equipment systems for chipmakers, dipped backed into my overall, long-term selected simple moving average (SMA). From here, stocks typically bounce or drop, but given the AI boom is far from "over", I anticipate another bounce

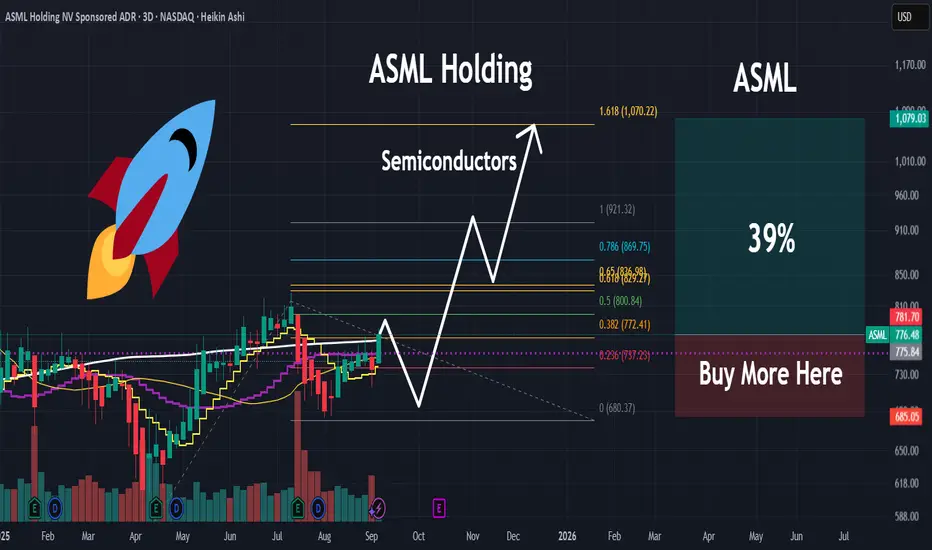
ASML | Something Is Brewing | SemiconductorsASML Holding NV engages in the development, production, marketing, sales, upgrading and servicing of advanced semiconductor equipment systems. It includes lithography, metrology and inspection systems. The company was founded on April 1, 1984 and is headquartered in Veldhoven, the Netherlands.
See all ideas
Summarizing what the indicators are suggesting.
Neutral
SellBuy
Strong sellStrong buy
Strong sellSellNeutralBuyStrong buy
Neutral
SellBuy
Strong sellStrong buy
Strong sellSellNeutralBuyStrong buy
Neutral
SellBuy
Strong sellStrong buy
Strong sellSellNeutralBuyStrong buy
An aggregate view of professional's ratings.
Neutral
SellBuy
Strong sellStrong buy
Strong sellSellNeutralBuyStrong buy
Neutral
SellBuy
Strong sellStrong buy
Strong sellSellNeutralBuyStrong buy
Neutral
SellBuy
Strong sellStrong buy
Strong sellSellNeutralBuyStrong buy
Displays a symbol's price movements over previous years to identify recurring trends.
XS247368710
ASML Holding NV 2.25% 17-MAY-2032Yield to maturity
2.99%
Maturity date
May 17, 2032
XS201003237
ASML Holding NV 0.25% 25-FEB-2030Yield to maturity
2.85%
Maturity date
Feb 25, 2030
XS152755619
ASML Holding NV 1.625% 28-MAY-2027Yield to maturity
2.48%
Maturity date
May 28, 2027
XS140578096
ASML Holding NV 1.375% 07-JUL-2026Yield to maturity
2.37%
Maturity date
Jul 7, 2026
See all ASMLF bonds
Curated watchlists where ASMLF is featured.


Frequently Asked Questions
The current price of ASMLF is 1,155.86 USD — it has increased by 8.53% in the past 24 hours. Watch ASML Holding N.V. stock price performance more closely on the chart.
Depending on the exchange, the stock ticker may vary. For instance, on OTC exchange ASML Holding N.V. stocks are traded under the ticker ASMLF.
ASMLF stock has risen by 10.18% compared to the previous week, the month change is a 4.40% rise, over the last year ASML Holding N.V. has showed a 64.51% increase.
We've gathered analysts' opinions on ASML Holding N.V. future price: according to them, ASMLF price has a max estimate of 1,527.11 USD and a min estimate of 822.29 USD. Watch ASMLF chart and read a more detailed ASML Holding N.V. stock forecast: see what analysts think of ASML Holding N.V. and suggest that you do with its stocks.
ASMLF reached its all-time high on Dec 3, 2025 with the price of 1,139.29 USD, and its all-time low was 5.05 USD and was reached on Oct 7, 2002. View more price dynamics on ASMLF chart.
See other stocks reaching their highest and lowest prices.
See other stocks reaching their highest and lowest prices.
ASMLF stock is 9.36% volatile and has beta coefficient of 1.71. Track ASML Holding N.V. stock price on the chart and check out the list of the most volatile stocks — is ASML Holding N.V. there?
Today ASML Holding N.V. has the market capitalization of 419.53 B, it has decreased by −3.66% over the last week.
Yes, you can track ASML Holding N.V. financials in yearly and quarterly reports right on TradingView.
ASML Holding N.V. is going to release the next earnings report on Jan 28, 2026. Keep track of upcoming events with our Earnings Calendar.
ASMLF earnings for the last quarter are 6.44 USD per share, whereas the estimation was 6.39 USD resulting in a 0.81% surprise. The estimated earnings for the next quarter are 8.77 USD per share. See more details about ASML Holding N.V. earnings.
ASML Holding N.V. revenue for the last quarter amounts to 8.82 B USD, despite the estimated figure of 9.08 B USD. In the next quarter, revenue is expected to reach 11.18 B USD.
ASMLF net income for the last quarter is 2.49 B USD, while the quarter before that showed 2.70 B USD of net income which accounts for −7.60% change. Track more ASML Holding N.V. financial stats to get the full picture.
ASML Holding N.V. dividend yield was 0.94% in 2024, and payout ratio reached 33.24%. The year before the numbers were 0.89% and 30.64% correspondingly. See high-dividend stocks and find more opportunities for your portfolio.
As of Jan 2, 2026, the company has 44.03 K employees. See our rating of the largest employees — is ASML Holding N.V. on this list?
EBITDA measures a company's operating performance, its growth signifies an improvement in the efficiency of a company. ASML Holding N.V. EBITDA is 14.36 B USD, and current EBITDA margin is 35.42%. See more stats in ASML Holding N.V. financial statements.
Like other stocks, ASMLF shares are traded on stock exchanges, e.g. Nasdaq, Nyse, Euronext, and the easiest way to buy them is through an online stock broker. To do this, you need to open an account and follow a broker's procedures, then start trading. You can trade ASML Holding N.V. stock right from TradingView charts — choose your broker and connect to your account.
Investing in stocks requires a comprehensive research: you should carefully study all the available data, e.g. company's financials, related news, and its technical analysis. So ASML Holding N.V. technincal analysis shows the strong buy rating today, and its 1 week rating is strong buy. Since market conditions are prone to changes, it's worth looking a bit further into the future — according to the 1 month rating ASML Holding N.V. stock shows the buy signal. See more of ASML Holding N.V. technicals for a more comprehensive analysis.
If you're still not sure, try looking for inspiration in our curated watchlists.
If you're still not sure, try looking for inspiration in our curated watchlists.