AMC.ASX: 16 JULY, 2024© Master of Elliott Wave Analysis: Hua (Shane) Cuong, CEWA-M (Master's Designation).
Forecast: Bullish
Details: Wave 2-grey has just bottomed at the low of 14.10, wave 3-grey is opening, to push higher.
Invalidation point: 14.10
Next report date
—
Report period
—
EPS estimate
—
Revenue estimate
—
0.68AUD
1.56 BAUD
21.85 BAUD
1.44 B
About Amcor plc
Sector
Industry
CEO
Peter Konieczny
Website
Headquarters
Warmley
Employees (FY)
41 K
Founded
2018
ISIN
AU000000AMC4
FIGI
BBG00LNJRW33
Amcor Plc operates as a holding company, which engages in the consumer packaging business. It operates through the Flexibles and Rigid Packaging segments. The Flexibles segment develops and supplies flexible packaging globally. The Rigid Plastics segment manufactures rigid plastic containers and related products. The company was founded 1926 and is headquartered in Warmley, the United Kingdom.

Bullish potential detected for AMC (gap continuation play)Detected 03-May (detailed commentary and full scan results available in the signature below). Not activated as at time of review of 03-May.
ASX:AMC represents a potential bullish opportunity should momentum continue and newer highs be made.
Entry conditions:
(i) higher share price above the day


$AMCR with a bearish outlook following its earnings #StocksThe PEAD projected a bearish outlook for $AMCR after a negative under reaction following its earnings release placing the stock in drift D with an expected accuracy of 50%.


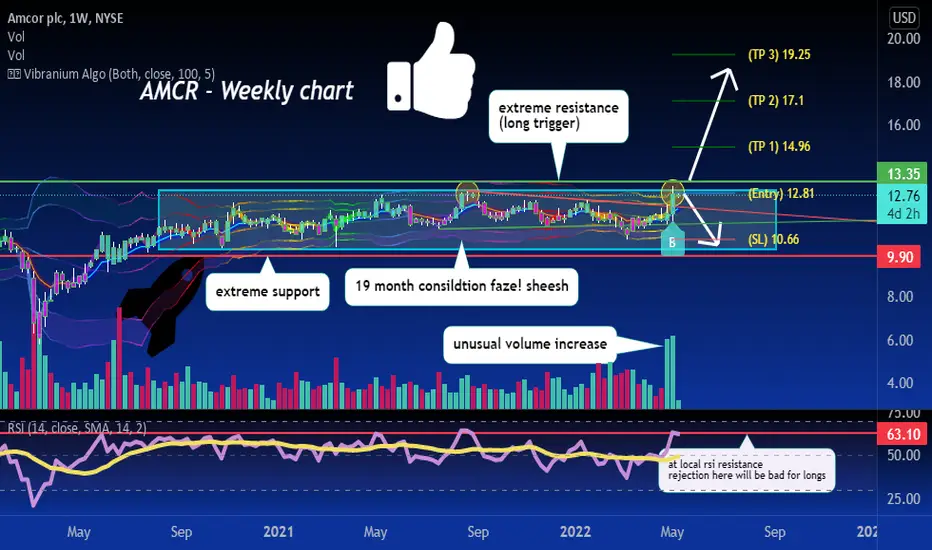
AMCR on the verge of breaking 19 month consolidation?you guys know my motto, after huge consolidation or downtrend we will see big breakouts in either direction!
a rejection at extreme resistance and a test 10-11 support is likely
Amcor Strong Breakout AMCRA strong Fibonacci circle trend line can be drawn, this is validated by the bottom along 4.618
Another trendline can be drawn along a down period that has been broken out of and under an attempt to move out of 1.618
Very bullish

AMCOR buy conditions set up.Amcor has set up conditions for a buy by having the RSI7 giving an alert by crossing up through 30 and the stochastic buy signal has crossed up through the 27 line and that, in turn, has been confirmed with the EMA21 being flat to rising.


Khan's Handelskontor - KW 40 - Swing Trade Idea 4 - $AMCRFound support at EMA 200, nice channel, accumulating shares towards earnings (11th Nov)

See all ideas
An aggregate view of professional's ratings.
Trade directly on the supercharts through our supported, fully-verified and user-reviewed brokers.

