SLR flag breakoutWow. textbook flag and pennet break
looking bullish... more and more
plenty of buying pressure will
keep this baby running for a while
SLR trade ideas

Gold rally might be over...at least for nowPotential weekly bearish pin-bar formation. If next week's closing price is below this week's low of 1.155, then it is very likely that price will hit the 1.075 mark (0.382 fib retracement). Otherwise, if SLR closes above this week's high of 1.300, then further upside is expected.


SLR triangle breakout SLR powering to the upside with this break out. Could be the merger with DRM causing some excitement in this company

New Longterm Uptrend Confirmation? Silver Lake Resources is currently trading at $0.65 per share, which is at double top formation in May 2018. The 0.618 Fibonacci support level around 0.455 seemed to be a very strong support; the stock is currently rising for more than 12 weeks(medium term up trend confirmed) since trading around the level for the second time November.
*The stock price broke above the major resistance level on 11 Feb 2019, several days before its update on the proposed merger with Doray.
Daily and weekly MACD looking good and the price action was supported by a spike in trading volume.
My view on the Stock is bullish. Best case scenario would be for the price to trade above last year's high briefly this week and coming down the resistance line for a retest as short term indicators is showing SLR is being over-brought.
I'm considering increasing my exposure to SLR/DRM then. Any ideas?

Silver Lake Resources - Not a silver miner but a gold minerAfter the price topped off at .65c, it retraced down to the .618 fib and is supported by the 200 day MA. Just below it in the .45c zone is a major historical support zone. An upward move in the gold price will provide an impetus for a break of the trend line and for the price to move. I think in this chaotic world, the gold price is just waiting for an opportunity to shine. But as always this is not a buy or sell recommendation nor is it investment advice.

SLR SLR - weekly chart shows 1) RSI breakout ... 2) trendline break
month chart shows BULLISH.. engulfing candlestick pattern ((reversal)
but month price candles are still below EMA line But at this moment some support buying has come in
to stop the price from falling.. it may have found a bottom... now lets see if the momentum can shift towards buyers... to attract more buyers.
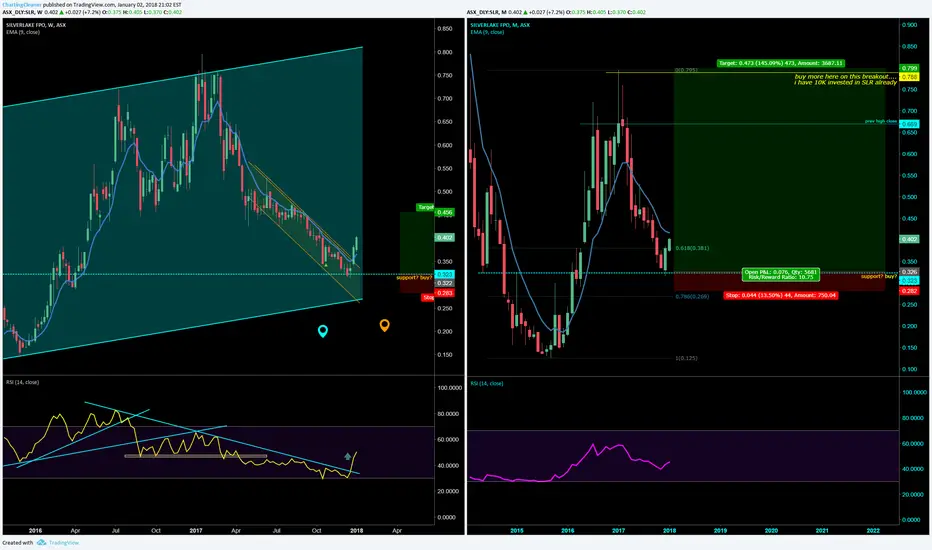
ASX:SLR week chart. price gap now filled. Buy more SLR if the price hits the lower bound of the current channel.
