AVAXUSDT- AVAX dipping into the Manipulation box
- Wait for a clear structure upside break out of the manipulation box for a potential long trigger
AVAXUSDT trade ideas

Trading Signal for AVAXUSDTDirection : Buy
Enter Price : 33.51
Take Profit : 36.63333333
Stop Loss : 30.64333333
We have identified a potential Buy opportunity for AVAXUSDT based on our analysis using the EASY Quantum Ai strategy. Here are the key factors behind our signal:
1. Trend Analysis : The AVAXUSDT pair has shown consistent upward momentum in recent sessions, suggesting a bullish trend. The 50-day moving average is above the 200-day moving average, confirming our buy signal.
2. Support and Resistance Levels : The enter price of 33.51 has been established near a strong support level, indicating that there might be a rebound from this point. Additionally, our take profit target of 36.63333333 aligns with recent resistance levels that the pair might test soon.
3. Technical Indicators : Our EASY Quantum Ai strategy has identified bullish patterns in several technical indicators such as RSI and MACD. The RSI is not in the overbought zone, indicating the potential for further upward movement. The MACD is also showing positive divergence.
4. Market Sentiment : Positive news and developments around AVAX and its technology have been contributing to a favorable market sentiment. This can push prices higher as investor confidence grows.
Please execute your trades using appropriate risk management practices.
Happy trading!

AVAX AI prediction - testingBased on AI analysis, the price movement for AVAX/USDT has indeed followed the AI model's prediction. The price prediction utilizes the following parameters:
Historical Price Data: Closing prices from previous periods.
Trading Volume: Daily trading volumes.
Technical Indicators:
RSI (Relative Strength Index): An indicator of the strength of the price trend, showing whether the currency is overbought or oversold.
MACD (Moving Average Convergence Divergence): An indicator that tracks changes in the strength, direction, momentum, and duration of a price trend.
Bollinger Bands: An indicator that measures volatility and provides relatively high and low price values.
ATR (Average True Range): A volatility indicator showing how much the price moves over a certain period.
The model uses these parameters for training and subsequent prediction of future price movements. These technical indicators and historical data help the model identify patterns and trends that may suggest future price movements. This approach enables the AI model to provide relevant and timely predictions that can be used for effective decision-making in the spot market.

AVAX has successfully broken the downward trendlineCurrently, the price of AVAX has successfully broken the downward trendline. If the price stabilizes at this level, returns to the specified ranges, and receives confirmation, we can accompany the price movement until it reaches the sell zones.

AVAX Analysis: Correction before RocketingAVAX is about to undergo a correction before reaching higher levels, surpassing its previous ATH of $120 and potentially setting a new all-time high at $1,300 IMO.

AVAX Analysis and Signal on 4HAVAX Analysis and Signal on 4H
🔵Entry Zone 35.00 - 35.96
🔴SL 33.48
🟢TP1 38.68
🟢TP2 41.42
🟢TP3 43.66
Risk Warning
Trading Forex, CFDs, Crypto, Futures, and Stocks involve a risk of loss. Please consider carefully if such trading is appropriate for you. Past performance is not indicative of future results.
If you liked our ideas, please support us with your likes 👍 and comments.

$AVAXCouple of ideas, swept the liquidity formed a BPR (Balanced Price Range)
Would be looking to bid that for a long targeting the EQH.

AVAXUSDT Buy setup We have bullish signal on AVAX H1 chart. This time risk reward is 1:5, Price retested strong demand zone. On H1 candles bulls showed their power, normally this kind of bullish OrderBlocks makes good moves on the market. Good luck!

Avalanche (AVAX): Possible Rejection From EMAs (100&200)Avalanche has had a nice rejection and now broke also EMAs (where price is currently re-testing them).
We are waiting for that rejection to be successful, which would result in further movement to lower zones, towards the support zone.
Swallow Team
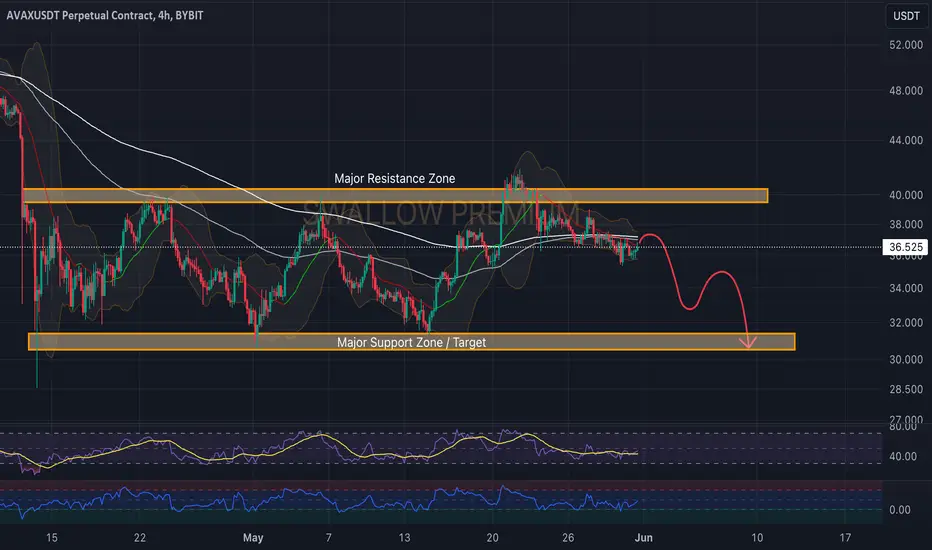
AVAX - CAME TO GLOBAL RESISTANCEAnalyzing the chart, it becomes obvious that the price is trading within the global resistance zone spanning from 44 to 56.
Given this context, it is wise to look for attractive short-term setups, as they are quite reasonable at this stage.
The initial target could be to remove liquidity behind the wick (x) at 27.24, and further targets could be to fill the imbalance on the daily timeframe (FVG) around 23.70.
The third target involves withdrawing liquidity at 18.90(x) and then targeting a significant imbalance (FVG) over a one-week period.
Here we can already start looking for good setups in the downward movement, we are waiting for our confirmation!

22/5/2024 AVAX Long TradeBy looking at 1D, we can see that AVAX was in Consolidate Area from 13/4 - 20/5
The Top and Bottom of the Consolidation Area is label with ORANGE line.
Finally, Avax has breakout the resistance of consolidation area.
Long Plan:
Entry 1 : 39.45 (Resistance become support) 50%
Entry 2 : 37.65 (Theoretically, This is where price could form a Higher LOW, White line) 50%
*I couldn't choose which entries is the best, so I pick BOTH
CL : within the Consolidation Area, Below 37.2 (add 2-3% buffer)
TP Zone : 47.63 - 50.74
(4H Looks)

AVAX/USDT upward momentum from descending resistance breakout? 💎 Paradisers! Keep a close watch on #AVAXUSDT as it shows strong indications of a bullish continuation following a breakout from its descending resistance.
💎 Reviewing recent movements, #Avalanche has effectively broken above its descending resistance and is now positioned for a rise starting from the demand level at $36.72. If it can maintain this momentum, we expect a vigorous advance toward higher levels, although some initial resistance might provoke a significant uptick.
💎 It’s crucial to consider that if the price struggles to maintain momentum at the current demand level, it could signal a softening of the bullish scenario. In such an event, we are prepared to capitalize on a bullish rebound from a lower support level at $35.11. The substantial liquidity at this level indicates that CRYPTOCAP:AVAX could mount a strong bullish recovery. Nonetheless, a breach below this demand level could lead to a notable decline in price.
MyCryptoParadise
iFeel the success🌴

AVAX LONG! Potential Swing Play to the upsideAVAX Long Position. on the 4-hour chart we see the wick is bouncing off of the 50 moving average. Confirmed the position with the Stock RSI indicator crossing over. Most Cryptos will be extremely Bullish Today. Also US30 stocks have a potential push as well, including Boeing.
It is possible we could see a huge wick to the downside so minimize your lot size for example, if you have a $10,000 account, minimize lot size to .10 lots on a 100:1 account.
place 2 x .05 lots.
STOP LOSS @ 35.15
TAKE PROFIT @ 40.53
ENTER NOW @ 37.14 or at US open for better entry.

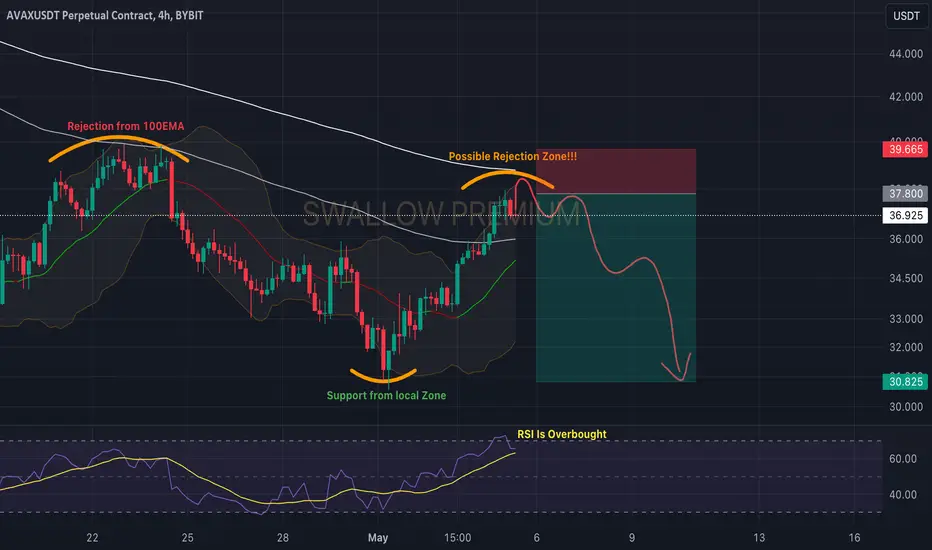
Avalanche (AVAX): Possible Zone Of Rejection / IncomingAvalanche had broken the 100EMA with a nice and steady upward movement here, which is now approaching the 200EMA threshold zone.
We are looking for a potential movement to lower zones near the current market price, which has also led RSI into the overbought zones.
If we see a nice rejection here, we will see further downward movement!
Swallow Team
AVAX/USDT It looks fake out, is need reclaim for back to upward!💎 Paradisers, #AVAX is indeed a coin worth monitoring closely.
💎 It has experienced a fakeout, indicating uncertainty in the market. This could lead to a potential test of the OB (Order Book) to gather liquidity before attempting to reclaim or break the resistance level for continued upward movement.
💎 However, if AVAX successfully reclaims the price above the resistance without testing the OB first, it may signal strong bullish momentum, potentially leading to a move towards the supply area around the $47 level.
💎 Breaking through the supply area is crucial to confirm a bullish trend reversal, indicating further upward movement for AVAX.
💎 Conversely, if AVAX fails to break through the supply area and experiences a strong rejection, the price may retreat and test the support level around $39.8, which previously acted as resistance.
💎 A concerning scenario would be if AVAX fails to bounce upon reaching the OB area, potentially leading to a breakdown and a move towards the key support level.
💎 In such a case, a bearish invalidation would occur if AVAX breaks below the key support level and the daily candle closes below it, signaling a continuation of the bearish movement with potential further downward momentum.
MyCryptoParadise
iFeel the success🌴


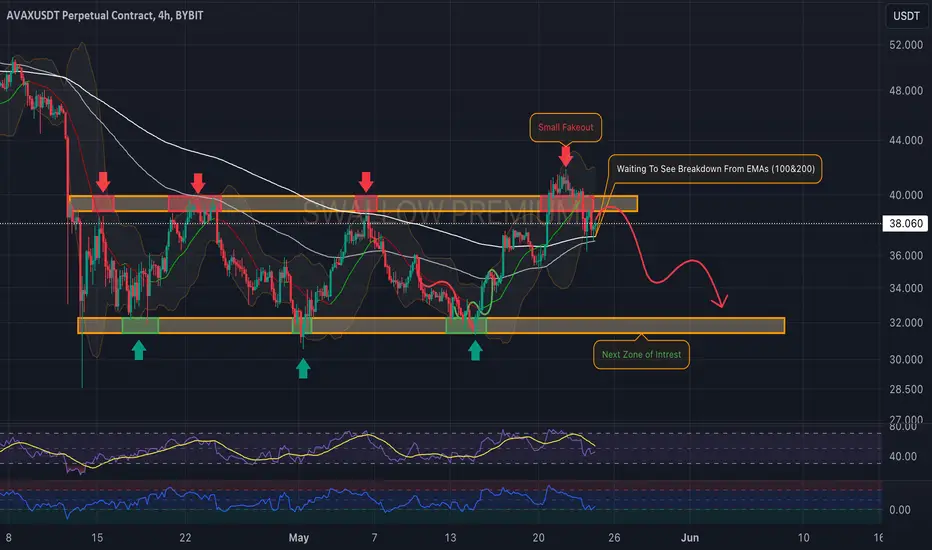
Avalanche (AVAX): Fakeout Or Breakout?Avalanche is still trading inside those zones where a recent touch to upper resistance has resulted in a nice breakout of EMAs and also a fakeout near the resistance zone.
We are looking now for a possible movement to lower zones here, but before that, we need to secure those EMAs.
Swallow Team
AVAXUSDT 23 May 2024 ( Result : Stop reached ) As a matter of fact , Avax has rosen after hitting our stop loss and that a little bad luck !
But we keep going forward and make the most out of market !

avaxavax technical analysis basically on elliott waves Principles
avax can be grow to 128$
wait and watch

🔥 AVAX End Of Accumulation, Bulls Rejoice!After a month of trading below the diagonal purple resistance line, AVAX has finally broken out. The break out was accompanied with high volume, further reinforcing the bullish narrative.
My expectation is that there's going to be some kind of altseason in the coming weeks, boosted by Ethereum's ETF optimism.
For now, the signal on chart is my bet.

AVAXUSDTBINANCE:AVAXUSDT
it seems we've formed a bullish trend with three upward waves and created an ascending channel on the daily timeframe. After the wave C, we experienced a downward move, breaking the bottom of the ascending channel. Additionally, we now have a bearish divergence between the highs A and C and the current situation finds us standing at the previous B bottom before wave C.
So If we break this support we might head towards retesting the $20 support
or retesting the descending channel between the price range of $42 to $43.
to see what unfolds.

Avax exits demandAVAX is finally exiting the weekly demand zone and consolidation phase on this BTC pump. I expect a steady push towards 60 dollars over the next few weeks. There is a ton of resistance between 41-43$. AVAX is finally back above the EMAs, that with the reversing stochastic on the weekly show the pivot.
Short-term: 43$ area
Medium-Term: 60$
Year target over 100$

Lingrid | AVAXUSDT pullback and CONTINUATIONThe price perfectly fulfilled my previous idea. It hit the target level. BINANCE:AVAXUSDT has recently extended its upward movement, successfully breaking through the key level at $40. On the daily timeframe, we can see that the market has finally broken out of the range zone that had been in place for a month. Furthermore, the daily candle formed a strong bullish signal, indicating a significant buildup of bullish pressure. I believe that the market is finally transitioning out of its accumulation phase and is likely to lead to an upward move towards higher prices. In this scenario, I expect a classic pullback and continuation pattern to play out. My goal is the resistance zone around 44.50.
Traders, if you like this idea or have your own opinion on this matter, write in the comments. I will be glad 👩💻
