AXSUSDT - 4H Bullish signsThe AXSUSDT 4-hour chart indicates a significant bullish breakout from a descending triangle pattern, typically a continuation pattern but here suggesting a reversal.
The price has breached the upper trendline of the triangle, signaling a potential upward movement.
The target for this breakout is set at approximately $9.40, as depicted by the green highlighted zone.
This target aligns with previous resistance levels observed in early April. The overall bullish momentum is supported by increasing volume, indicating strong buying interest.
AXSUSDT trade ideas

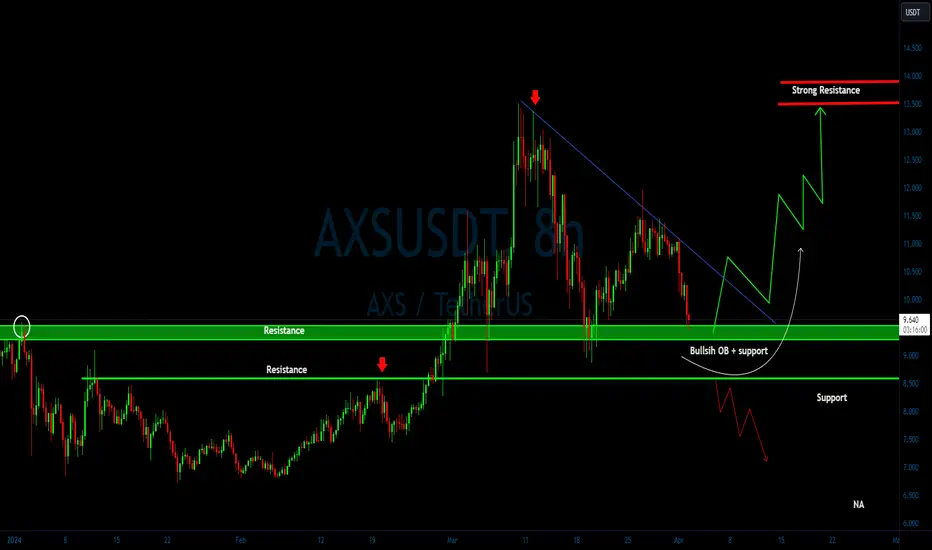
Alikze »» AXS | Pullback to the roof of Minor is brokenIn the 4H time, after a zigzag correction to the $6 range, it has been within a trading channel for some time.
💎 In time 1D, an FVG gap is observed. Therefore, if this return to the minor ceiling is supported by the green box, it can have a growth to fill this gap in the first step.
💎 In addition, in the case of strong momentum, this growth can be extended to the supply area.
💎 Alternative scenario: Considering that it is currently at the top of the channel, if it is not stabilized at the top of the green box, it can continue the correction to the middle of the channel and then to the bottom of the channel in the green box area.
»»»«««»»»«««»»»«««
Please support this idea with a LIKE and COMMENT if you find it useful and Click "Follow" on our profile if you'd like these trade ideas delivered straight to your email in the future.
Thanks for your continued support.
Sincerely.❤️
»»»«««»»»«««»»»«««


🦋”AXSUSDT Breakout Confriemd ” 🦋 🚀📈Dear Traders,
We are convening a discussion focused on #AXSUSDT
---------------------
⏰ Time Frame:8H
THE Trendline Breakout Has Already Done ✅
Also Its on Major Support Level ✅
So,I am Expecting a Bullish Move of 35% 🚀😉
Regards: 🦋AnnaTradeCharts🦋
#Bitcoin #Crypto #Ethereum #Cryptocurrency #CryptoTrading #BTCUSDT #ETHUSDT #ALTCONS #USDT CRYPTOCAP:BTC CRYPTOCAP:ETH CRYPTOCAP:USDT CRYPTOCAP:PEPE CRYPTOCAP:DOGE NASDAQ:ALT

AXS and Many alt are in the configurationHello there.
Big picture here. H&S Shoulder inverted.
We have many like it. Depend only of btc of course.
Don't hesitate to put order for new buy now or on the blue support.
x2 on here for target.

AXS BUY Based on the provided chart for AXS/USDT on a 1-day timeframe from Binance, here's a detailed trading plan:
### Entry Point
- **Entry Zone**: Between 6.420 and 7.190 USDT
- This range represents a significant support zone where the price is likely to find buying interest.
### Target (Take Profit) Levels
- **First Target (TP1)**: 8.913 USDT
- This level is the nearest target where the price is likely to encounter resistance.
- **Second Target (TP2)**: 9.890 USDT
- This level aligns with previous resistance and is a reasonable next target.
- **Third Target (TP3)**: 10.709 USDT
- This level is a higher resistance zone and aligns with previous price action.
- **Fourth Target (TP4)**: 12.619 USDT
- This level is a higher resistance level and a long-term target.
### Stop Loss
- **Stop Loss**: 5.736 USDT
- This stop loss level is set below the support zone to protect against a deeper downside move.
### Key Levels and Observations
- **Resistance Levels**:
- 8.913 USDT
- 9.890 USDT
- 10.709 USDT
- 12.619 USDT
- **Support Levels**:
- 7.190 USDT (upper entry zone)
- 6.420 USDT (lower entry zone)
### Technical Indicators
- **Volume Profile**: Shows high trading activity around the entry zone, suggesting strong interest and potential support.
- **ABCD Pattern**: Indicates the potential price move based on the harmonic pattern, suggesting possible retracement levels and target zones.
### Trade Plan Summary
1. **Enter** the trade within the 6.420 to 7.190 USDT range.
2. **Set Stop Loss** at 5.736 USDT to manage risk.
3. **Target Levels**:
- **First Target (TP1)** at 8.913 USDT.
- **Second Target (TP2)** at 9.890 USDT.
- **Third Target (TP3)** at 10.709 USDT.
- **Fourth Target (TP4)** at 12.619 USDT.
Always remember to manage your risk appropriately and adjust your trade parameters based on market conditions.

AXS Analysis and Signal on 4HAXS Analysis and Signal on 4H
🔵Entry Zone 7.343 - 7.561
🔴SL 6.827
🟢TP1 8.118
🟢TP2 8.758
🟢TP3 9.532
Risk Warning
Trading Forex, CFDs, Crypto, Futures, and Stocks involve a risk of loss. Please consider carefully if such trading is appropriate for you. Past performance is not indicative of future results.
If you liked our ideas, please support us with your likes 👍 and comments.

AXSUSDT.1DUpon reviewing the daily chart of AXS/USDT, several significant points and technical indicators can be highlighted for a comprehensive analysis.
Key Resistance and Support Levels:
Resistance 1 (R1): $8.453 - This is the first significant barrier where the price may encounter selling pressure.
Resistance 2 (R2): $9.783 - A higher level of resistance, which could serve as a mid-term target if bullish momentum continues.
Resistance 3 (R3): $11.959 - This marks a notable high and a critical level for any substantial bullish trend.
Support 1 (S1): $6.096 - The most immediate support, which could provide a bounce-back point if the price dips.
Technical Indicators:
Relative Strength Index (RSI): At 39.91, the RSI is currently below the midline of 50, suggesting bearish momentum but also potential for a price reversal if it moves towards and above 50.
Moving Average Convergence Divergence (MACD): The MACD line is very close to the signal line but below it, with a histogram slightly below zero, indicating mild bearish momentum. A crossover above the signal line could signal a shift towards bullish behavior.
Trend Analysis:
The price action shows a downtrend, recently stabilizing around the S1 level. This stabilization might suggest the potential for a reversal if supported by increased buying pressure.
Candlestick Patterns:
Recent candlesticks around the S1 level do not indicate a strong reversal yet. The presence of smaller bodies with short wicks suggests consolidation rather than a decisive movement.
Conclusion:
The current market condition of AXS/USDT presents a cautious outlook. With the RSI under 50 and the MACD showing slight bearish momentum, it's important for potential buyers to look for signs of a reversal, such as a bullish candlestick pattern or a MACD crossover above the signal line. A break above R1 at $8.453 could confirm a bullish trend, targeting subsequent resistance levels. However, traders should set stop losses below S1 to mitigate potential losses if the downtrend resumes. Keeping an eye on volume and market sentiment will be crucial to validate any potential bullish entries.

$AXSwaiting for the gaming narrative to kick in!
this will tell me I'm a wizard without telling me I'm a wizard


AXS: Channel Down PatternTrade setup : Trends are mixed. Price is trading in a Channel Down pattern. With emerging patterns, traders who believe the price is likely to remain within its channel can initiate trades when the price fluctuates within its channel trendlines. With complete patterns (i.e. a breakout) – initiate a trade when the price breaks through the channel’s trendlines, either on the upper or lower side. When this happens, the price can move rapidly in the direction of that breakout.
Trend : Downtrend on Short- and Medium-Term basis and Uptrend on Long-Term basis.
Momentum is Mixed as MACD Line is above MACD Signal Line (Bullish) but RSI < 45 (Bearish).
Support and Resistance : Nearest Support Zone is $7.0, then $5.5. The nearest Resistance Zone is $9.0 (previous support), then $11.0 - $12.0 and $14.0.

AXSUSDT IDEAHello Traders Hope You Are Enjoying Our Analysis. Today We Will Discuss About AXS
(Update)
The Descending Channel Formation In 12H Timeframe⚡️
Expecting Massive Bullish Wave When Breakout Occurs✍️

AXSUSDT 1D#AXS is moving in inside a descending channel and has broken the MA200 to the upside on the daily chart which is a bullish sign. Targets are:
$8.752
$9.571
$10.390
$11.556
$13.042

AXSUSD 1WAXS ~ 1W 📈
#AXS Pattern H&S Formed here. this is the Bull Pattern. We will be buying in stages here with small trades, with a minimum target of 15%+

$AXS - Forming a huge inverse head & shoulders in weekly chart?NYSE:AXS looks incredible good if this inverse head & shoulders fromation plays out. The price is currently on a -95% retracement from it's ATH, talking about barghain this could be once serious opportunity to buy cheap and make profits. If crypto bullrun continues, we could be ahead of a massive move incoming, target is 140 usd or the sky, if CRYPTOCAP:BTC manages to keep going above 80k.
Everything below 4 usd is demand zone for NYSE:AXS , keep accumulating, and hold hold hold!!!

AXS: Approaching SupportTrade setup : Trends are mixed. Price had a bearish breakout from a Descending Triangle pattern.
Swing Traders: could enter near $7.00 support and 200-day moving average, which should be a robust support zone, with +25% upside potential back to $9.00. Price is also getting oversold (RSI ~ 30), which means that we could see a brief bounce up near-term. Stop Loss (SL) level at $6.00.
Trend : Downtrend on Short- and Medium-Term basis and Uptrend on Long-Term basis.
Momentum is Bearish but inflecting. MACD Line is below MACD Signal Line and RSI is below 45 but momentum may have bottomed since MACD Histogram bars are rising, which suggests that momentum could be nearing another upswing.
Support and Resistance : Nearest Support Zone is $7.0, then $5.5. The nearest Resistance Zone is $9.0 (previous support), then $11.0 - $12.0 and $14.0.

AXSUSD 1WAXS ~ 1W
#AXS Make purchases in stages from here with a minimum target of 20%++. Retesting of this support was successful.

AXS BULLISH STRUTURE IN 4H TIMEFRAMEAXS is breaking out in 4h timeframe,20 - 30% growth is expected. Targets and SL are given in alongside chart.

AXS USDTAXS Risky trade. remember always use stop-loss
Entry 9.743
S.L 9.3434
T.P 1 10.089
T.P 2 10.483
T.P 3 10776

AXS Analysis: Symmetrical Triangle Breakout and Market IndicatorThis analysis examines the recent price action of BINANCE:AXSUSDT AXS, focusing on the symmetrical triangle pattern and its potential breakout scenarios.
📉🔺Parabolic Move and Symmetrical Triangle:
AXS experienced a parabolic price surge and subsequently entered a symmetrical triangle pattern.
This pattern indicates a period of consolidation and uncertainty before a potential breakout.
🔽Breakout Scenarios:
A breakout from the triangle could lead to two main scenarios:
1. Upward Breakout: A breakout above the triangle's upper resistance could signal a continuation of the upward trend.
2. Downward Breakout: A breakout below the triangle's lower support could indicate a bearish reversal and a downward movement.
📊🔺Market Indicators and Considerations:
The direction of Bitcoin dominance and the Total Crypto Market Cap (TMC) index can influence AXS's price action.
In the 4-hour timeframe, the 50 EMA is acting as a support level, potentially affecting price movement.
⛔Additional Considerations:
False breakouts are possible, and traders should exercise caution and rely on confirmation indicators.
Analyzing other technical indicators and market sentiment can help refine trade entry and exit strategies.
🚫This analysis is for educational purposes only and should not be construed as financial advice. Always conduct your own research and employ sound risk management practices before trading.

AXS/USDT bullish horizon from support? 👀🚀AXS Today analysis💎 Paradisers, let’s delve into the intriguing movement of #AXSUSDT. Presently, it’s engaged in a delicate dance, retracing and meticulously retesting a critical support level at $9.379. This level holds immense significance, and its ability to transition from a mere retest to a robust support could be the harbinger of a potential bullish surge.
💎 After a triumphant escape from the clutches of a descending channel, the price of #AXS now approaches the key support level at $9.379. If it maintains its momentum at this crucial juncture, we may witness a delightful bullish reversal. Picture it: the price ascending, breaking free like a phoenix from the ashes.
💎 But ah, the markets are fickle, my friends. Should the price of NYSE:AXS dip below this pivotal zone, our strategy must adapt. Brace yourselves! We anticipate a bullish rebound from the secondary support level at $8.578. Failure to reclaim ground here could spell further declines. So, stay vigilant, stay nimble, and let’s navigate these market fluctuations with grace and precision
AXS/USDT/AXIESBeing on this space is good as long as you win, I have more haters than followers which i love it.
You want to make more moneeee, stay updated to new gold coin. but as an advice but not your financial advisor, this is not a financial advice. trade it or hold it.
AXIES to the moon? highest speculation is 63$.
I'm interested on lower price coin. if you have one comment down below, I would love to give a charts update on it.
$AXIES is trading below most of the owner of this coin not interested on selling it, its just a price reprice in below, it means it needs more demand. demanding the price is way more better than selling their coin.
I will update this once target being accumulated.
NOTE : this is not a financial advice, I'm not your financial advisor.
This coin is GAMing most of my friend their in PH play this.

Axie Infinity Wake UpI believe Axie Infinity has rooms to grow. Despite we see gradual rise in most crypto, metaverse tokens still lack liquidity for unknown reason. In case we see liquidity flow, first target for Axie Infinity is $14.69, then it can rise between $19 to $42 for now.
