BCHUSDT trade ideas

BCH, ready for another ROUND to the UPSIDE!BCH, has been consolidating at the 240ish range for a few days now. Price has been moving horizontally with thin volatility suggesting a firm support at the current levels.
It's currently at the 38.6 FIB level -- a first level support for buyers.
On Daily histogram (top indicator), it has recorded its first bottom-wave shift line after almost 7 weeks. Last one was on June 13. This bottom-wave shifting line usually appear as a prerequisite before a surge in prices. New bubble up volume has appeared after almost two weeks suggesting firm support of buyers at the present range.
Daily higher lows has been created -- with first white light candle in sight.
On monthly data, it has recorded it's 2nd net positive volume increase signifying a firm support on the intended goal direction: UPSIDE.
Expect some significant price ascend from here on.
Spotted at 248.0
TAYOR.
Safeguard capital always.

Bitcoin Cash Analysis - Breaking the Box Ceiling and Continuing 💹 Let's dive into this cryptocurrency and examine our entry and exit points for trading and profit-taking.
🌟 We have a new program on this channel, in addition to daily analyses, from Monday to Wednesday:
Bitcoin and its dominance analysis on Monday
Ethereum and ETHBTC analysis on Tuesday
Gold analysis on Wednesday
I hope these bring you significant profits.
📊 Weekly Time Frame:
After breaking out of a weekly box where we oscillated for around 350 days, we began our upward movement by surpassing the resistance at 140.2.
During this upward trend, the volume decreased during corrective phases and increased as the trend resumed, indicating a strong bullish formation.
💡 It's crucial to understand the significance of boxes in higher time frames before analyzing the daily time frame. If you’ve noticed, most coins are still ranging within their long-term boxes. However, breaking out of these boxes can initiate a new trend. Some coins to watch for such breakouts include SOLANA, LINK, BCH, ETH, and ICP. Paying attention to weekly box breakouts is highly recommended.
⏰ Daily Time Frame:
In the daily time frame, after repeatedly hitting the 281.5 resistance and seeing a reduction in sell orders, we broke out of the box ceiling and continued our higher time frame movement. One of the indicators for this was the significantly reduced volume within the box.
📆 Post the 281.5 breakout, we moved towards the 709.4 resistance. After failing to continue the upward movement, the buying pressure decreased, and selling pressure increased. Currently, we are ranging between 521.8 and 423.6.
📉 Four-Hour Time Frame:
In the four-hour time frame, following a significant market correction, we failed to resume the upward movement, resulting in a ranging market.
🏦 This time, after getting rejected from the 521.8 ceiling, we only dropped to 450.2 and didn’t reach the box floor. This indicates two things: the absence of sellers to push the price to the box floor and the presence of buyers preventing the price from dropping further, both suggesting a bullish sign.
📈 Long Position: Wait for a breakout above the 521.8 resistance. Given the bullish higher time frame, we can enter a long position in line with the trend.
📉 Short Position: Either wait for a strong rejection candle or for a trend change with a lower high and lower low formation.
🔑 We also have a parabolic-like trend line, but since we are currently within the box, we won’t analyze patterns yet. However, if we break out of the box, this could help us.
📌 Support Levels: 500.7, 474.8, 444.2
📌 Resistance Levels: 521.8, 562.0, 605.9
🛡️ As the week comes to an end, I hope you’ve had a profitable week and wish you a great weekend ahead. Enjoy your rest and start the new week with renewed energy and enthusiasm!
😊 If you'd like me to analyze a specific coin or currency pair, be sure to comment so that I can allocate the next analysis for you!
⚠️ Also, please remember that I'm just an analyst, and this isn't financial advice. We're here to stay in the market and maximize profits by adhering to risk and capital management principles.

Bitcoin Cash - Bullish contracting triangleBitcoin Cash - Bullish contracting triangle
The price broke out from a bullish contracting triangle.
It looks like Bitcoin cash already reached the bottom and it may rise again.
This is in line with another analysis I published some time ago.
You can find it on the related charts.
The first and strongest resistance zone will be found at 474 which is also the first target
zone.
Another strong zone is found near 491 for this short-term trading scenario.
You may find more details in the chart!
Thank you and Good Luck!
❤️PS: Please support with a like or comment if you find this analysis useful for your trading day❤️


#BCH/USDT#BCH
The price is moving within a 1-day ascending channel pattern, which is a retracement pattern
We have a bounce from a green support area at 405.00
We have a tendency to stabilize above the Moving Average 100
We have an upward trend on the RSI indicator that supports the rise and gives greater momentum
Entry price is 466.05
The first target is 571.10
The second goal is 620.40
The third goal is 692.20

BCHUSDT #02 ( BCH is ready for Bullish move ,fasten seat belts )Hello dear traders.
Good days.
Monthly And Daily Bullish Gann Square Reversal time zone matched and exactly after that bull run started .
On long shy view Monthly Gann Square we can see 5000 $ price around Nov-2025 , but on Daily Gann Square Time Frame as you see on chart we can expect 830 $ price for BCHUSDT which is 0.618 Daily Gann Box price level .
It can increases to about 1000 $ on daily Time frame which will be 0.75 Gann Box price level.
Road map is plotted with help of Gann Square and Gann Box.
Good luck and safe trades.
Thanks for your support and comments .

BCHUSDT-Bullish Pennant Pattern Formation...!Dear Traders,
We are convening a discussion focused on #BCHUSDT
The Bullish Pennant Pattern Breakout Has Already Done ✅
So,I am Expecting a Bullish Move of +90% 🚀😉
#crypto #cryptocurrency #bitcoin #ethereum #blockchain #btc #cryptotrading #cryptonews #eth #cryptocurrencies #nft #bitcoinnews #bitcoins #trading #bitcoinmining #forex #binance #cryptoart #nfts#trading #forex #trader #investing #stocks #forextrader #stockmarket #daytrader #forextrading #invest #bitcoin #daytrading #cryptocurrency #crypto #investor #investment #forexsignals #nse #chartpattern #cedarforex #candlepatterns #learntrading #bseinstitute #shorttermtrade #bankniftytrading #stockmarketph #calloptions #mqlsignal #futuretrader #tradingmemes #chartpatterns #tradingview #tradinglife #tradinglifestyle #tradingstrategy #tradingtips #tradingplan #tradingsignals #tradingaccounts #tradingsignal #tradingforex #tradingsync #tradingroom #litecoin #ethereum #bitcoincash #cryptocurrencies #ripple #btc #bitcoinnews #bitcoinmining #blockchain #eth #bitcoin #bitcoins #coinbase #cryptocurrency #crypto #bitcointrading #dogecoin CRYPTOCAP:BTC CRYPTOCAP:ETH CRYPTOCAP:USDT CRYPTOCAP:PEPE CRYPTOCAP:DOGE NASDAQ:ALT

BCH ANALYSIS🚀#BCH Analysis :
🔮As we can see in the chart of #BCH that there is a formation symmetrical triangle pattern. Also there is a perfect breakout. But there is an instant resistance zone and if #BCH sustain this breakout and also breakout the resistance 1 zone then we would see a bullish move📈📈
🔰Current Price: $492.9
🎯 Target Price: $700
⚡️What to do ?
👀Keep an eye on #BCH price action. We can trade according to the chart and make some profits⚡️⚡️
#BCH #Cryptocurrency #TechnicalAnalysis #DYOR

BCHUSDT IDEAHello Trading view Family / Fellow Traders.
I hope you have used and benifited from the previous analysis .
In today trading session we are monitoring BCHUSDT for a buying opportunity,
BCHUSDT UPDATE
In 1D Timeframe, Bearish pennant Breakout is Done & Retesting is in Process✅
Successful Retest Can Lead Massive Bullish Rally Towards 720$ 💸🚀

BCH ( Bitcoin Cash ) tm:1hHello traders.
I hope you doing well.
These areas are based on my personal strategy and I will share it with you.
Open a sell position on the supply area or open a buy position on the demand area.
Your entry point, stop loss, and target point are based on money management and the amount of money in your trading account.
But I promise you that by trading in the areas of my trading strategy, you will definitely make a profit, because these areas, although they seem simple, are my experience of 8 years of learning and trading.
I hope you will achieve maximum continuous profit with me by using supply and demand areas.
Good luck traders.
Mohammad Goodarzi


BCHUSD Bitcoin Cash/USD Bearish Robbery Plan To take moneyMy Dear Robbers / Traders,
This is our master plan to Heist BCHUSD Market based on Thief Trading style Technical Analysis.. kindly please follow the plan I have mentioned in the chart. Our target is Green Zone that is High risk Dangerous level MA act as a Dynamic Support & Order Block, So the Market is oversold / Consolidation / Trend Reversal at the level Bullish Robbers / Traders gain the strength. Be safe and be careful and Be rich.
Note: Day traders & Scalpers If you've got a lot of money you can get out right away otherwise you can join with a swing trade robbers and continue the heist plan,
Loot and escape on the target 🎯 Swing Traders Plz Book the partial sum of money Use Trailing Stop To Protect Looted Money and wait for next breakout of dynamic level / Order Block, Once it is cleared we can continue our heist plan to next new target it will update after the Breakouts.
support our robbery plan we can easily make money & take money 💰💵 Join your hands with US. Loot Everything in this market everyday.

Long signal for BCH/USDTThis technical analysis is based on the daily chart of BINANCE:BCHUSDT on the Binance exchange. This analysis draws two price channels and evaluates support and resistance levels.
Price Channel Analysis:
The previous bearish channel is broken out, and a bullish channel is formed.
The suggested entry point is around 457 USDT.
Entry and Exit Points:
Entry: 457 USDT
Take Profit: 530 USDT (15.96%)
Stop Loss: 414 USDT (9.41%)
R/R Ratio: 1.70
Conclusion:
This analysis suggests that by adhering to the specified take profit and stop loss levels, a successful trade can be achieved. The Reward/Risk Ratio for this trade is approximately 1.70, indicating a favorable risk-to-reward scenario. To manage risk effectively, it is recommended to strictly follow the stop loss level.

Bchusdt trading opportunityBCHUSDT is displaying a potential rounding bottom formation, suggesting the formation of a cup and handle pattern upon price testing the neckline area. Our plan involves accumulating the coin towards the immediate buyback zone while focusing on the crucial demand level, currently acting as significant support.
The rounding bottom neckline is identified as a potential sell-off area, marking the beginning of a correction for the handle formation.
Subsequently, breaking above the neckline will confirm the final setup target, as indicated on the chart.
We welcome your feedback on our analysis. Your comments and likes are highly valued and appreciated.

BCH/Bitcoin Cash is showing to resume the upward trendBCH/Bitcoin Cash is showing to resume the upward trend
The price broke out from an "Inverse Head & Shoulders" pattern.
This indicates that the price may resume the bullish trend again.
BTC had the same pattern yesterday and performed well.
📺You may watch the video for further details📺
Thank you and Good Luck!
❤️PS: Please support with a like or comment if you find this analysis useful for your trading day❤️

#BCH On Fire: Don't Miss Out on This Buy Trade!**Technical Analysis Chart Description:**
Welcome to my Technical Analysis charts on TradingView! Before we dive into the analysis, it's essential to understand some important warnings:
1. **Subjectivity Alert:** Technical analysis involves interpreting market data and chart patterns, which can be subjective. Different analysts may interpret the same data differently, leading to varied conclusions.
2. **Historical Performance Doesn't Guarantee Future Results:** Past price movements do not guarantee future price movements. While historical data can provide insights, it's crucial to consider other factors that could influence price action.
3. **Risk of False Signals:** Technical indicators and chart patterns can produce false signals, leading to potential losses if relied upon blindly. Always cross-verify signals with other indicators or fundamental analysis.
4. **Market Volatility:** Crypto markets are highly volatile and can experience rapid price fluctuations. Be prepared for sudden and unexpected price movements, which may invalidate previously identified patterns.
5. **Risk Management:** Proper risk management is essential. Never invest more than you can afford to lose, and consider using stop-loss orders to mitigate potential losses.
6. **Emotional Bias:** Avoid emotional decision-making based on short-term price movements. Stick to your trading plan and strategy, and don't let fear or greed influence your decisions.
**Disclaimer for Crypto Trading:**
Trading cryptocurrencies carries inherent risks, and it's important to understand the following:
Cryptocurrency markets are highly speculative and can be subject to extreme volatility. Prices can fluctuate significantly within short periods, leading to substantial gains or losses.
Investing in cryptocurrencies involves the risk of total loss of capital. Unlike traditional assets, cryptocurrencies are not backed by any tangible assets or central authority, making them inherently risky.
Regulatory uncertainty and market manipulation are additional risks associated with cryptocurrency trading. Regulatory changes or negative news can have a significant impact on prices.
This analysis is for informational purposes only and should not be construed as financial advice. It's crucial to conduct thorough research and consult with a qualified financial advisor before making any investment decisions in the cryptocurrency markets.
By using this analysis, you acknowledge and accept the risks associated with cryptocurrency trading and agree to trade at your own discretion. The author of this analysis shall not be held responsible for any losses incurred as a result of using the information provided.

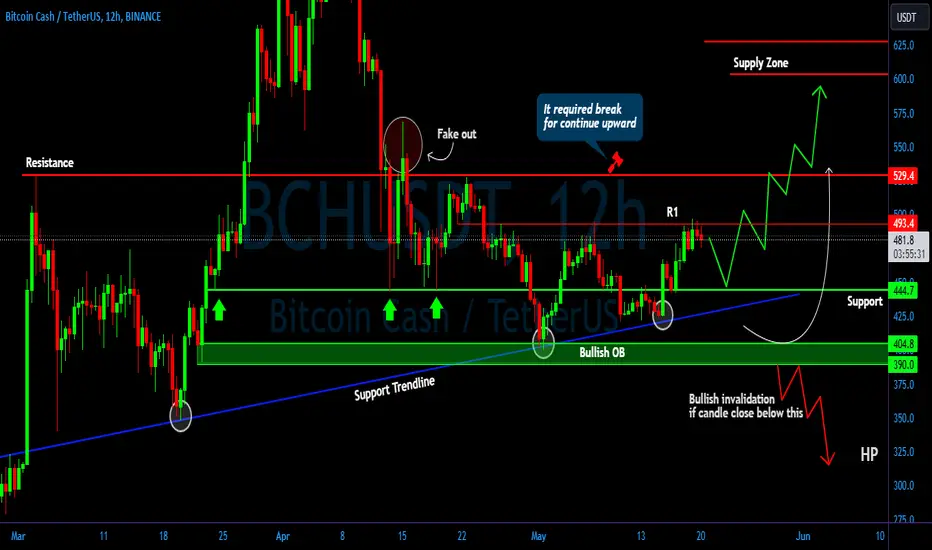
BCH/USDT It shows reject potential will revisit the support area💎 Paradisers, #BCH is indeed a coin worth monitoring closely.
💎 It appears that BCH faced rejection at the resistance level after attempting to break out. Based on current price action, there's potential for BCH to retest the support area around 445. If this scenario plays out, we might witness a bounce from this support level, with BCH resuming its upward trajectory and attempting to break above the resistance at 493.
💎 A successful breakout above 493 could pave the way for BCH to target the 530 area, which serves as the next significant resistance level. Breaking through this level would be crucial for BCH to sustain its upward movement and potentially reach our target supply zone area.
💎 However, if BCH fails to bounce from the support area and even breaks below it, the next target would be the support trendline. This level is critical as it represents a key support level that BCH needs to bounce from to maintain a bullish outlook.
💎 If BCH also breaks below the support trendline, there's still one more opportunity for support at the Bullish OB area around 405 - 390. A successful bounce from this area, accompanied by a reclaim of the support level, could signal a bullish momentum shift for BCH.
💎 On the contrary, if BCH breaks below the Bullish OB area, it would confirm bearish sentiment, and the bullish invalidation would be valid. In this scenario, we could expect BCH to continue its downward trajectory, potentially experiencing further dips.
MyCryptoParadise
iFeel the success🌴
Bitcoin Cash $BCH looks primed for a leg upApart from the obvious slanted Inverse Head and Shoulders pattern ( I prefer upward-slanted-neckline inverse H&S as printing higher highs indicate strength ), BINANCE:BCHUSDT looks ready to take off - under some conditions.
I have a personal rule I go buy that goes like " Every Change of Character is an inducement to trap traders unless proven otherwise ".
We have broken out of the slanted Inverted H&S and broke the previous high (between the head and the right shoulder) which would count as a Change of Character (keep in mind the rule I have mentioned above).
In order to avoid falling into the trap of inducement, we should wait for the price to go a bit higher to confirm a more solid ChoCh, then wait for the price to retrace back and bounce up off a demand zone / OB+ (and possibly successfully retesting the Inv. H&S neckline) making a higher low and going all the way up to break the high that caused the Change of Character, thus confirming the flip in trend.
I do not have any specific targets, I have been holding NYSE:BCH for a while and I am in it for the long run but the golden pocket of Fibonacci retracements is a decent area to book some profit (or all of it).
🚨 Always manage your risk and use adequate position size.

BCH Has Formed An Inverse H&SLet's analyze BCH on the daily chart! Let’s dive 🤿
1) BCH has formed a sideways inverse H&S pattern, which is known as a reversal pattern. The neckline of the inverse H&S pattern has been broken, confirming the pattern. The target price would be $600 per BitcoinCash 🚀
2) We also have the Double Bottom pattern, which forms this way: When some buyers purchase crypto at the bottom and push the price up to the Neckline, it gets rejected by sellers. After that, the price falls again to the same bottom line. Then, another group of buyers enters and buys at the bottom, pushing the price back up to the Neckline. If buying pressure is strong enough, the Neckline will get broken. Once the Neckline is broken, sellers become worried because the momentum is changing, creating an upward trend! Currently, we are in this situation 🚀
3) And lastly, a bullish scenario for BCH is that it has broken a one-month downward trend line. This is another confirmation that we are changing momentum 🚀

BCH USD 1D - Elliott Wave & Fibonaci RetracementBased on the Elliott Wave count, we are currently in the fourth wave (4) of the Bitcoin cycle.
If the pattern continues, the fifth wave (5) could lead to significant price appreciation.
Target level is 1.618 or above before correction. Somewhere in mid - end June.

BCH USD 1DBitcoin Cash (BCH):
Bitcoin Cash is a cryptocurrency that emerged as a spinoff of the original Bitcoin blockchain.
It was created to address scalability issues and provide a more efficient electronic cash system.
BCH aims to be cheaper, faster, and more scalable than Bitcoin for everyday transactions.
Historical Journey:
August 2017: Bitcoin Cash was officially launched and distributed to Bitcoin holders at a ratio of 1:1 (one BCH for each Bitcoin held).
Similarities to Bitcoin:
Shared the same blockchain until the hard fork.
Total supply capped at 21 million.
Differences from Bitcoin:
BCH can support 25,000 transactions per block, compared to Bitcoin’s 1,000 to 1,500 transactions per block.
BCH’s price experienced significant volatility:
December 2017: BCH hit an all-time high of $4,355.62.
Bear Market: Lost 80% of its value over the next six months.
January 2021: A new bullish cycle began, driving BCH to a peak of $1,636 in May 2021.
June 2021: Price fell 75% to $40.
How Bitcoin Cash Works:
Users send and receive BCH on the blockchain using public-key information.
Miners compete to discover new blocks using proof-of-work consensus.
BCH uses the same SHA-256 hashing algorithm as Bitcoin.
Bull Market Comparison:
If we compare Bitcoin’s bull market cycles since its halving dates, we see growth percentages from each halving.
The longer the consolidation, the more explosive the markup tends to be.

BCH / USDTBitcoin Cash (BCH):
Bitcoin Cash is a cryptocurrency that emerged as a spinoff of the original Bitcoin blockchain.
It was created to address scalability issues and provide a more efficient electronic cash system.
BCH aims to be cheaper, faster, and more scalable than Bitcoin for everyday transactions.
Historical Journey:
August 2017: Bitcoin Cash was officially launched and distributed to Bitcoin holders at a ratio of 1:1 (one BCH for each Bitcoin held).
Similarities to Bitcoin:
Shared the same blockchain until the hard fork.
Total supply capped at 21 million.
Differences from Bitcoin:
BCH can support 25,000 transactions per block, compared to Bitcoin’s 1,000 to 1,500 transactions per block.
BCH’s price experienced significant volatility:
December 2017: BCH hit an all-time high of $4,355.62.
Bear Market: Lost 80% of its value over the next six months.
January 2021: A new bullish cycle began, driving BCH to a peak of $1,636 in May 2021.
June 2021: Price fell 75% to $40.
How Bitcoin Cash Works:
Users send and receive BCH on the blockchain using public-key information.
Miners compete to discover new blocks using proof-of-work consensus.
BCH uses the same SHA-256 hashing algorithm as Bitcoin.
Bull Market Comparison:
If we compare Bitcoin’s bull market cycles since its halving dates, we see growth percentages from each halving.
The longer the consolidation, the more explosive the markup tends to be.
