Trade ideas

Potential gap fill setup $ebay saw over 12,000 march 11th 24.5 calls trade on friday - almost $600,000 worth with a smiley skew there could be upside here. Given the market is quite overbought I would time this trade with the overall market if taken.

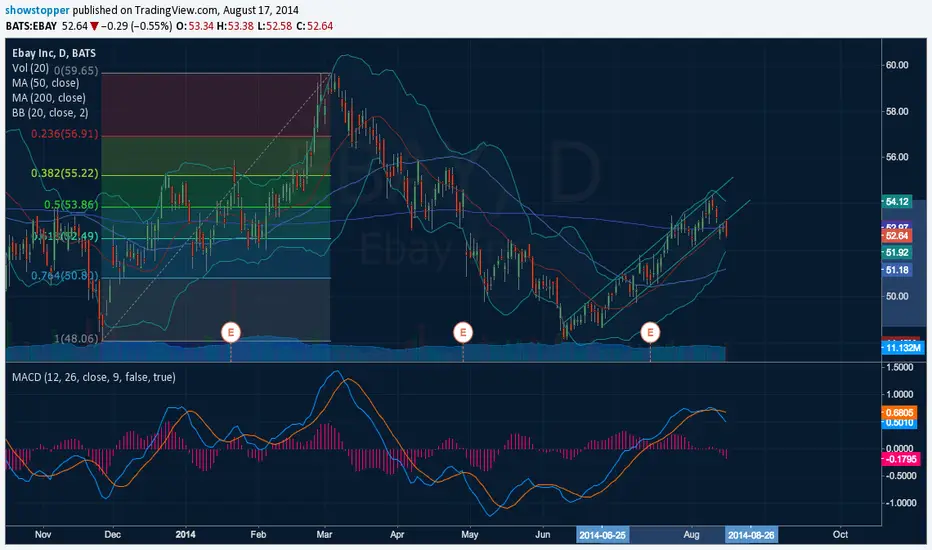
Elliot Wave EbayTaking a long position from the bottom of the second correction as we go into the 3rd upwards wave

EBAY: Time at mode downtrend spottedEbay is offering an interesting short setup here.
This is an entry for Tim West's Key Hidden Levels' chatroom's contest.
Pick a stock, get the biggest profit in ATR's and win by the next weekly close.
Happy new year everyone!
Cheers,
Ivan Labrie.


EBAY Wekly 5 wave impulse wavePotentially a completed 5 wave move from the 2009 lows. The1st target is the previous 4th wave at $46.00. The 2nd target is at $38.00. Based on the NDX idea, I would strongly advise anyone long to sell and go to cash, aggressive traders can look to sell. Wave appears to be a possible ending diagonal so a strong clue to support the idea of a 5th wave.


Ebay: Looks Really Promising for Nice Bullish Bounce!Friends,
Nice move out of this area is expected. Notes on chart
Regards
tom

EBAY SHORT 51.94 / 47.98 / 41.86EBAY a break below 56
Put B/Options exp -End of mth
SHORT Targets 51.94 / 47.98 / 41.86


Consolidation, $10 range for more than a yearLikely acquisition candidate. One way to play - Apr 50 short Puts/Apr 65 long calls, neutral debit/credit w some risk

EBAY Day Trade Perfect Gap N Go (Brad Reed Jan22,2015)EBAY expected to open at 54.79 for a Perfect Gap N Go. To learn to trade this strategy for free, go to www.RealLifeTrading.com


Ebay - At sell zoneEbay has been trading sideways for a long time and has provided some great trades
I have traded Ebay only from the long side until now, this is my first short on it. The entry and stop loss levels are taken from my trading platform. The only worry I have is that the previous candle, a closing Marubozu, happened during the New Year's Eve, which is a pointless day for taking signals. However, the bearish divergence on the histogram is still there, and so is the false breakout. These two signals, combined with candle confirmation, when at buy/sell zone have produced fantastic trades.

$EBAY short idea $EBAY held under $57,50 resistance for several months until a fake breakout came in February 2014(zoom out far enough you'll see that price revisited the high set back in late 2004 at $59,21) and has been unable to make higher highs since. The week of October 13th painted a new low on the chart and was the first lower low since December 2012. We saw a 4 week relief rally back into channel resistance, however as price was rising, volume was declining. To add to the storm, last weeks price action painted a lovely shooting star reversal candle right near channel resistance, which is in confluence with the .618 fib retracement. If this thing is looking to roll over, a nice low risk entry would be on the break of last weeks low at $54,23 which was tested today. If this level cracks, we may see $EBAY rollover and flush back into trendline support. Stay tuned folks!

Ebay Inc - EBAY - Daily - Where's the beef? No momentum...Rolling over from a small rally within a long, sideways consolidation.
EBAY is doing its best to grow into its valuation, but in the meantime it is up to $17 billion in sales to support is hefty $64 billion market cap. Unfortunately, this chart shows the latest period has brought earnings to a standstill, which certainly means that EBAY is going the way of Amazon and not making any profits.
I look for more downside, albeit slowly, as EBAY tries to generate earnings and revenue growth to help keep this stock "afloat".
Tim 11:11AM EST 52.10 last EBAY 9/22/2014


ebayanalyzing the weekly chart we can see that the prices are in a sideways trend (50-57.50) last week we have a candle of indecision (maximum 57.05 Closing 50.50) with high volumes then most likely in area 55/56 we can get a discount on first support of 52.50 where for another and also supported by the moving average of 21 periods and subsequently the other media 50

EBAYYou don't get this type of setups posted in advance @ sites like Stocktwits or Yahoo. Make $$$ here.


Ebay support from fib .618? Price action could move back within the channel due to current support from fib .618 level.