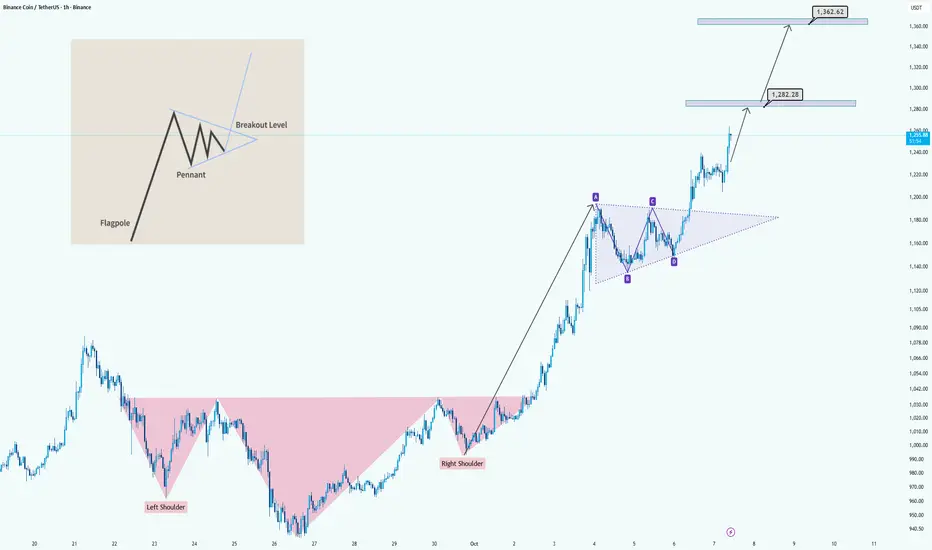
BNB/USDT: Bullish Breakout from H&S and Pennant FormationHi guys!
The chart clearly shows a bullish structure forming after a strong upward move. Initially, the price completed an Inverse Head and Shoulders pattern , signaling a potential trend reversal from bearish to bullish. After the breakout above the neckline, the market continued to climb and sta
BNB/USDT | BNB Smashes $1200 Target – Momentum Remains Strong!By analyzing the BNB (Binance Coin) chart on the weekly timeframe, we can see that the price continued its bullish rally exactly as expected, breaking multiple new all-time highs (ATHs) and hitting the $1200 target.
It’s now trading around $1220, and the previous analysis remains valid. The next ups

Binance Coin Positioned For 16% Upside Toward $1,280 TargetHello✌️
Let’s analyze Binance Coin’s price action both technically and fundamentally 📈.
🔍Fundamental analysis:
BNB burns have cut supply ~30% since 2017, while big holders like BNB Network Company push demand. Less supply and concentrated buying could boost price, as past burns often led to

Long trade
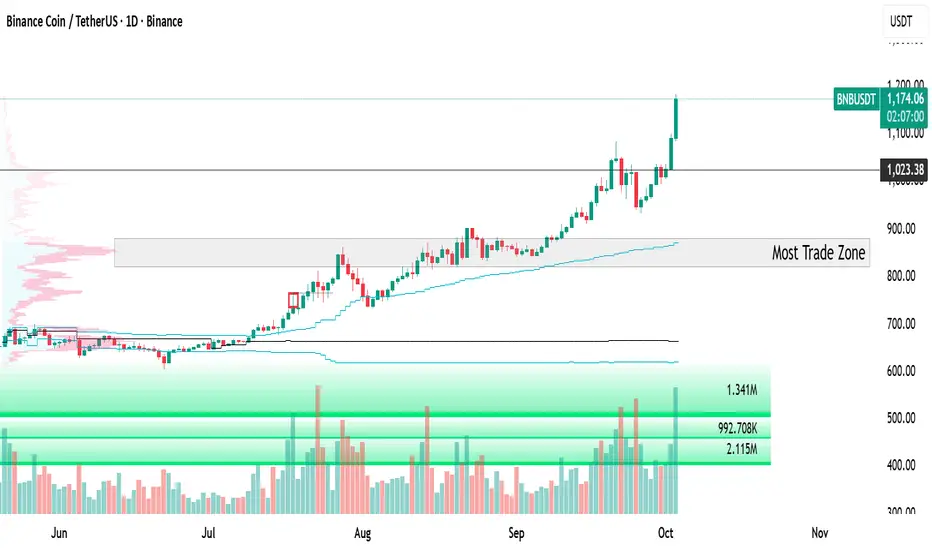
📌 Trade Journal Entry – BNBUSDT
Trade Type: Buyside
Date/Time: Friday, 26th Sept 2025 – 11:00 AM
Session: London to New York Session AM
Pair: BNBUSDT Perpetual (1H timeframe)
🔑 Trade Details
Entry: 1,042.02
Profit Level (TP): 1,082.87 (+14.93%)
Stop Level (SL): 1,035.16 (-0.75%)
Risk–Reward Rati

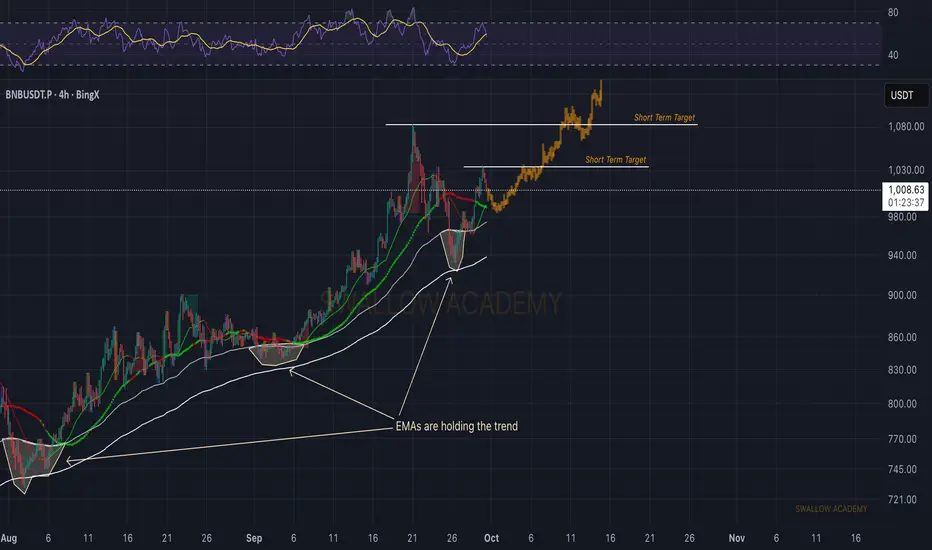
Binance Coin (BNB): Respecting the EMAs | Bullish AFBNB continues to respect the EMAs, with each dip finding strong support and buyers stepping in to hold the trend.
The bounce from the latest retest shows momentum is still in buyers’ favor, and as long as this structure is protected, short-term targets are around $1,030 and $1,080 (as long as buye
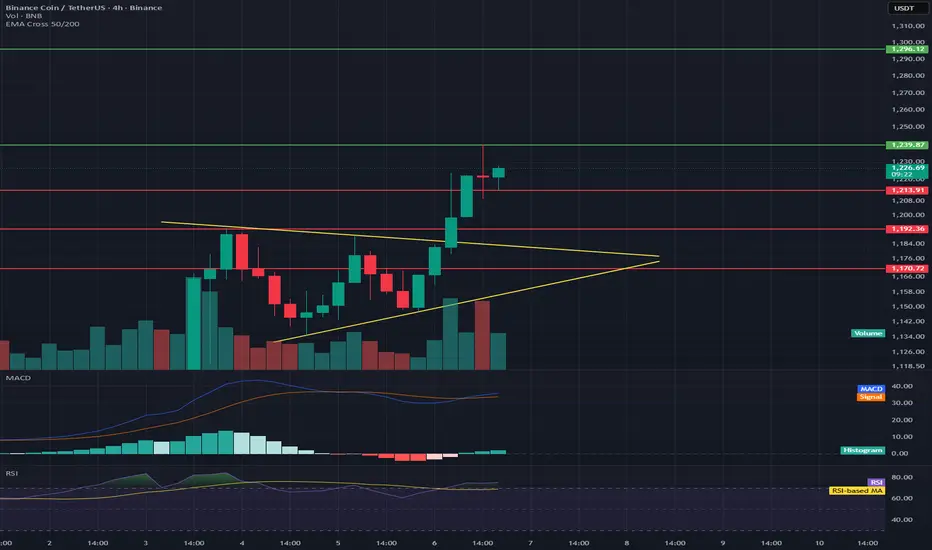
BNB/USDT 4H Chart Review📊 Market Structure
The chart shows a symmetrical triangle (yellow lines) from which a breakout occurred upwards—a classic signal of a continuing uptrend.
The price has broken above resistance at ~$1,210, which now acts as local support.
Current price: ~$1,226, following a dynamic breakout from th
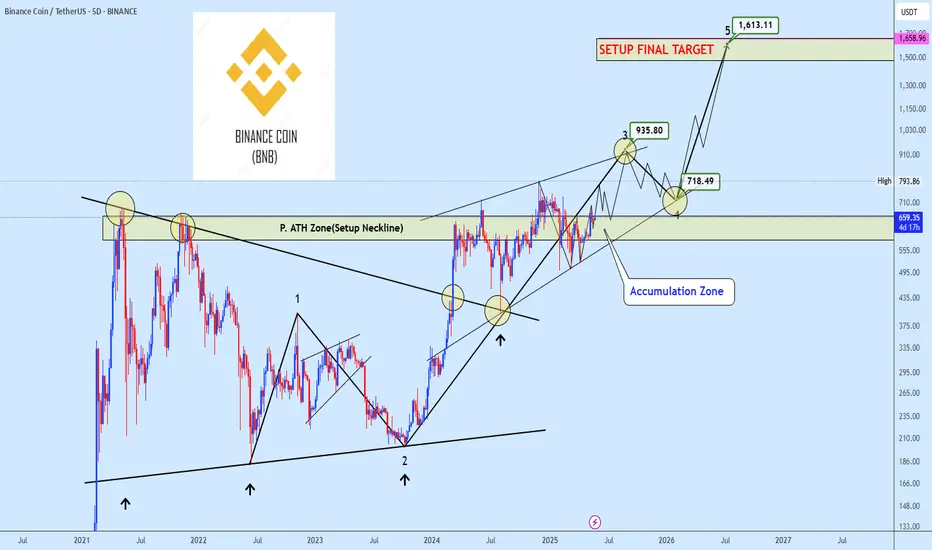
BNBUSDT preparing for major upside RallyBNBUSDT has broken out of a major bullish structure and has since transitioned into a well defined ascending wedge, suggesting the development of an extended Wave 3 within an impulsive Elliott sequence.
Price is currently progressing toward the projected Wave 3 target around $935, a level that als
BNB needs to restThe higher the BNB rises without consolidation, the sharper the correction risk becomes. The correction is coming, and this is the target:
www.cointrust.com
BNB Soars Above Key SupportLooking at this $BNB/USDT chart, here's a more concise breakdown:
Rising Support: The red line shows a strong support level that has held up since 2018, with the price bouncing off it several times, confirming its importance.
Accumulation Zone: Between 2020 and 2021, BNB traded sideways, build

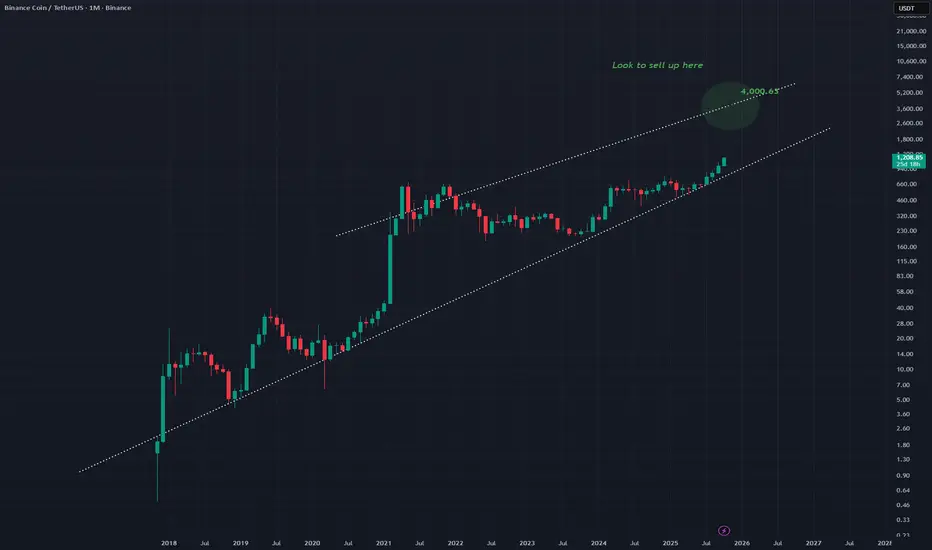
BNB - Room to Move Up I think on this monthly timeframe price still has room to move up throughout the rest of 2025.
The structure in white is a rising wedge and allows for the next bear market.
Bullish medium term
See all ideas
Summarizing what the indicators are suggesting.
Oscillators
Neutral
SellBuy
Strong sellStrong buy
Strong sellSellNeutralBuyStrong buy
Oscillators
Neutral
SellBuy
Strong sellStrong buy
Strong sellSellNeutralBuyStrong buy
Summary
Neutral
SellBuy
Strong sellStrong buy
Strong sellSellNeutralBuyStrong buy
Summary
Neutral
SellBuy
Strong sellStrong buy
Strong sellSellNeutralBuyStrong buy
Summary
Neutral
SellBuy
Strong sellStrong buy
Strong sellSellNeutralBuyStrong buy
Moving Averages
Neutral
SellBuy
Strong sellStrong buy
Strong sellSellNeutralBuyStrong buy
Moving Averages
Neutral
SellBuy
Strong sellStrong buy
Strong sellSellNeutralBuyStrong buy
Displays a symbol's price movements over previous years to identify recurring trends.
Curated watchlists where BNBUSDT.P is featured.

Interest-earning crypto wallets: Put your digital money to work
12 No. of Symbols

Proof of Stake: Seeking validation?
26 No. of Symbols
See all sparks