How To Use The "Rocket Booster" Strategy In Gold PriceThis is a video about how to use the
"Rocket Booster" Strategy to find
--
a good buy position in Gold
--
Watch it Now To Find Out How
XAUTRYQ2020 trade ideas

Gold might be ready to pop UPThe CPI numbers come out tomorrow. That could be the impetus for gold to run in to new highs in the coming weeks. What is needed is a strong close above the 50 ema as shown in the red circle to the left. Getting into this trade to go long before such a confirmation would be a mistake, IMO.
We can also see that near the circle on the left the price touched the 200 ema area, and that recently happened again about 2 weeks ago.
Lastly, a daily trend line has also recently been broken. It is pretty short but still significant. Good luck! (Again, the price must close strongly above the 50 ema!)
PS: a measured move could send GC to around 2170 before its tops for awhile; 2170 is very speculative, just a possibility; in the possibility of more bank failures maybe in Sept, the price could go a lot higher. All conjecture.

td sequential buy set upm30 9 td sequential happed on previous resistance that now become support
also price action from candle is show low momentum before hit support
so good bet for 1.5+ RR

Bobby's homework assignment7.20.23 On this video we're taking it closer look at Tesla which is at A reversal area Looking at multiple Tools and indicators. I also Ran across 135 patterns and thought that I should introduce that to Bobby. I also talked about trend lines and how I use them. All of this will be new for Bobby and take some time to ingest... but in a month all the stuff I'm talking about will be automatic for Bobby..... including the range boxes and the way that I work with gaps. The hardest part Is starting. However the most important time is the honeymoon.... So if we can get Bobby through the next two or three weeks and he has a fairly good familiarity with the tools... that's when things will fall into place and in many ways be a lot easier.


#Gold #XAGUSD To Test Monthly Projected Range ResistanceIn this update we review the recent price action in the Gold futures contract and identify the next high probability trading opportunity and price objectives to target
•Past performance not indicative of future results

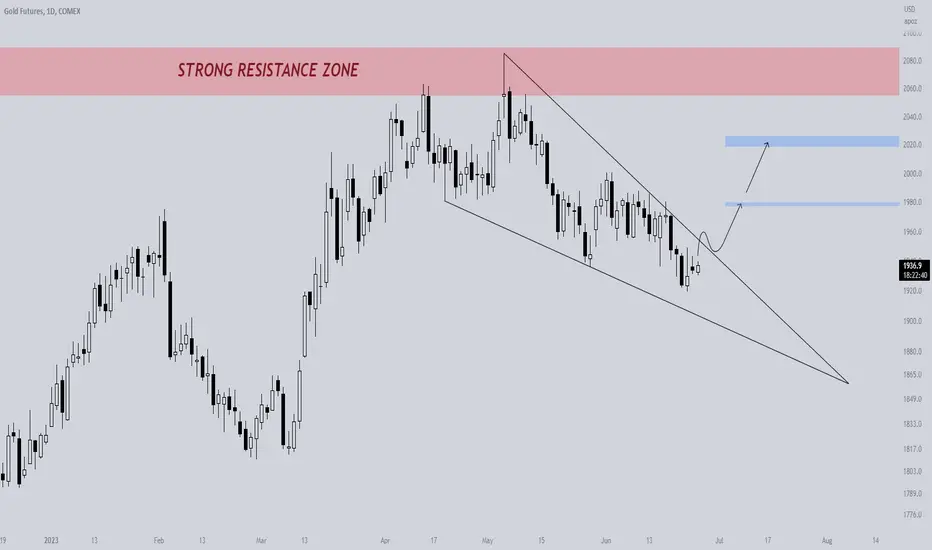
GOLD - Falling wedge pattern
- 1D
Currently, gold is drawing a Falling wedge pattern.
It is likely to try to break through the top of the wedge soon.
Let's see.
Gold As we can see, the market hasn't surpassed the high point. This suggests that we may witness a correction or accumulation, or even a reversal.

GOLD FUT 2HOURLY CHARTGOLD FUT 2HOURLY CHART
Cmp 1930 Breakout @ 1937 on close basis Target 1978
Time to keep an eye on.
It's only an observation & not any suggestion.

Gold For me after this powerful volume , it's time to take your profit , but we goin to wait until the end of this candle , if it end red we going to close , if not we going to follow the trend

GoldAfter these days of accumulation, I believe it's the end. Following this breakout, it marks the beginning of an uptrend.

Gold buyers could see $1900 as a bargainGold futures have fallen nearly 9% since the May high, but there are signs that it is trying to form a base around $1900.Whilst the psychological round number has helped to play a part, it also coincides with a volume cluster in the rally at the beginning of March. We therefore see the potential for a minor bounce at a minimum from current levels whilst prices hold above $1900.
Large speculators remain net-long, although their exposure has been trimmed as prices have fallen. Yet we're not seeing a material pickup in gross-short exposure to indicate a much more bearish outlook from speculators.
Furthermore, softer US inflation data on Friday weighed on the US dollar and helped to support gold - and gold could rise further if we see any weakness in data this week (ISM manufacturing data is out today, challenger jobs and ADP employment on Thursday and of course Nonfarm payroll on Friday).
The highs around $1948 are the initial target for bulls to consider, with the potential for a move towards $2000 if we're treated with a host of weak US data to prompt further calls for the Fed's terminal rate.
A break below $1900 invalidates the near-term bullish bias.

Gold: Rearing up 🐎Gold has been rearing up once more but should soon return below the support at $1936 to continue the overarching downwards movement until the low of wave (4) in yellow is found, which we expect to happen below the turquoise zone between $1840 and $1713. However, there is a 30% chance that the precious metal could use the turquoise zone to finish wave alt.2 in turquoise instead. In that case, gold would turn upwards from there, rising back above $1936 and further northwards.

Gold reaching for new highs?Incredible to think with the Dollar bouncing Bullish that the price of Gold will rise but that is what the PA is showing and I do not argue with that

Digital and technical analysisWe see that there is a lack of buying momentum and we are in a major bullish correction

Gold (GC futures) weekly updateThis chart is the same as drawn way back, still standing with it.
I have two targets for gold in first quarter 2024, lower path (purple arrow) is 2100 area, and 2407 area (higher purple arrow), which is a Gartley extension dating back to September 2018 (last Fed hiking cycle).
Natural progression would be along the lower target, but a macro event (such as confrontational superpower war) would easily propel to higher trajectory target at 2407.

GOLDThe gold today looks powerful and positive for attacking the resistance and breaking the range. After this powerful pullback with good volume, it's time to buy.

Gold After witnessing this breakout with significant volume, the market appears to be indicating a downtrend for today.

Gold broken above wedge new target $2,081Falling Wedge has formed on Gold since April 2023.
This has been a turn for the good.
We've seen the price breakout and now we can expect the demand to continue.
7=21>200 - Bullish
RSI >50 (Buy divergence with the level breaking the downtrend.
Target $2,081
This will reflect on gold companies too which we can be bullish on. Happy to go long here.

Mcx Gold ForecastGold bulls trying to take control over 100 sma and 50% fibbo... More highs waiting...

GOLD,Daily, BUY SIGNALGOLD is giving a Buy Signal (Long Position) for the daily time frame. we are expecting it going up
these next days as we have shown in the chart. we set Stop at 1899.3

my indicator setup in gold..( historical)this is a setup that was formed in gold using my indicator..
that target was achieved..
this is just for learning..
not a trade advice
just paper trade/

Live Trading Session 227: Trade setups and Open PositionsIn this live trading session,we look at potential trades setting up for the week and open positions on Gold,GBPUSD,S&P 500,Brent Oil,Bitcoin and many more.
