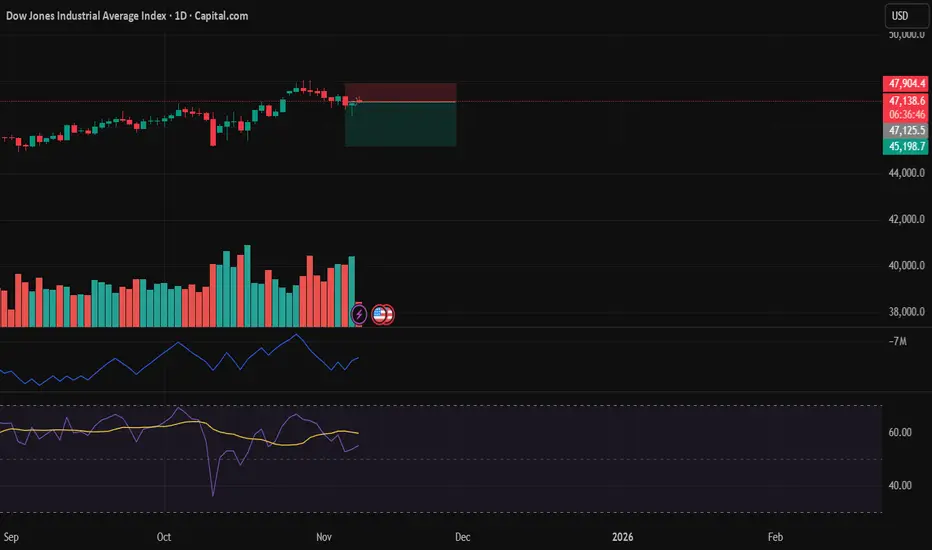
DOW JONES INDEX GOES 'CUP AND HANDLE' PATTERN. HERE'S WHYA cup and handle is a bullish technical analysis pattern that signals a continuation of an uptrend and a potential buying opportunity. It appears as a U-shape (cup), followed by a slight decline or consolidation (handle), after which further price gains are expected. The pattern was popularized by William O'Neil in 1988.
Cup and Handle
Cup: A U-shaped movement that forms when an asset's price, after a rally, initially pulls back and then recovers to its previous highs.
Handle: After completing the cup, a slight correction or consolidation occurs, appearing as a downward-sloping line, sometimes shaped like a small cup. The handle typically forms on lower trading volume.
How it works
Buy: Traders look for a breakout from the handle amid rising trading volume, which is considered a buy signal. Trend Continuation: The pattern indicates that after a short pause, the asset is likely to continue its upward movement.
Target Calculation: The target price is often calculated by measuring the cup height and adding it to the breakout price to forecast the potential price movement.
What to Consider
The pattern can form on various timeframes, from intraday to monthly charts.
It is important to pay attention to the depth of the cup and handle, as well as the trading volume that confirms the signal.
Due to nearly 50% retrace we consider to take it up rn.
--
Best wishes,
@PandorraResearch Team
Trade ideas

Sell US30Trade what you see and not what you feel
The chart says it all. You can decide own stop loss. We move. Sisonke.

Can the Dow Jones Continue Its Bullish Momentum This Week?🚀 US30/DJI Dow Jones - Bullish Pullback Opportunity 📈
Professional Market Blueprint | Swing Trade Setup
📊 TRADE OVERVIEW
Asset: US30/DJI - Dow Jones Industrial Average Index
Timeframe: Swing Trade (4H-Daily)
Bias: 🟢 BULLISH - Hull MA Pullback Strategy
Confirmation: Heikin Ashi Reversal Candle Pattern
🎯 ENTRY STRATEGY - "LAYERING METHOD" 🎯
Approach: Multiple limit orders (Professional Risk Distribution)
Layer Entry Points:
Layer 1: 46,600 🔵
Layer 2: 46,800 🔵
Layer 3: 47,000 🔵
Layer 4: 47,200 🔵
💡 Tip: Adjust additional layers based on your risk tolerance and account size
🛑 RISK MANAGEMENT
Stop Loss: 46,400
⚠️ DISCLAIMER: This is a reference level only. You manage your own risk. Adjust SL according to your strategy and risk profile.
Take Profit Target: 48,800
📌 Rationale: Moving Average resistance + Overbought zone + Trap detection
⚠️ DISCLAIMER: This is a reference level only. You manage your own risk. Take profits at your own discretion.
📈 TECHNICAL CONFLUENCE
✅ Hull Moving Average - Bullish alignment & pullback structure
✅ Heikin Ashi Reversal - Confirmation candle pattern at entry zones
✅ Moving Average Resistance - Strong rejection level near TP
✅ Overbought Divergence - Potential trap for trap traders
✅ Risk/Reward Ratio - Favorable 1:3+ setup potential
🔗 RELATED PAIRS TO WATCH - CORRELATION ANALYSIS
📍 AMEX:SPY - S&P 500 ETF (Positive Correlation - 0.92)
US30 follows broad market sentiment. SPY strength = DJI bullish momentum.
📍 NASDAQ:QQQ - Nasdaq-100 ETF (Positive Correlation - 0.85)
Tech sector performance impacts overall market. Monitor for divergence signals.
📍 AMEX:IWM - Russell 2000 (Small Cap) (Positive Correlation - 0.88)
Small-cap rotations precede index moves. Early trend confirmation signal.
📍 AMEX:GLD - Gold Spot Price (Inverse Correlation - -0.45)
Risk-on sentiment (bullish DJI) = weaker gold. Inverse hedge setup.
📍 TVC:VIX - Volatility Index (Inverse Correlation - -0.70)
Rising VIX = market fear = DJI pullback risk. Monitor at entry zones.
📍 TVC:US10Y Yield (Negative Correlation - -0.55)
Rising yields pressure equities. Check yield strength before entries.
📍 TVC:DXY - US Dollar Index (Weak Negative - -0.30)
Stronger dollar = export headwinds. Minor impact, secondary indicator.
⚡ KEY TRADING RULES
🔴 BEFORE ENTRY:
Confirm Hull MA slope is positive
Wait for Heikin Ashi reversal candle close
Check VIX & SPY alignment
Ensure no major economic events
🟢 AT ENTRY:
Use layering strategy (don't chase)
Build position gradually across 4 layers
Scale risk based on account size
Document entry price & time
🟡 DURING TRADE:
Trail stop loss after +1% profit
Monitor related pairs for divergence
Close 50% at +2% for risk-free trade
Let remainder run to target
🔵 EXIT PLAN:
Target: 48,800 (reference level)
Or: Exit on Heikin Ashi reversal signal
Or: Close on MA resistance rejection
Never hold into major news events

Dow Jones Indus (US30)Price has completed a clean sweep of sell-side liquidity and is now showing strong displacement toward the upside. The recent break in structure confirms short-term bullish intent.
If price returns to the fair value gap or discount zone, I’ll look for confirmation to enter in alignment with the intraday bullish flow.
My first target remains the internal liquidity zone, and the potential extended target is the previous day’s high where buy-side liquidity rests.

DowJones Uptrend continuation breakout supported at 47088Key Support and Resistance Levels
Resistance Level 1: 47536
Resistance Level 2: 47670
Resistance Level 3: 47536
Support Level 1: 47088
Support Level 2: 46913
Support Level 3: 46737
This communication is for informational purposes only and should not be viewed as any form of recommendation as to a particular course of action or as investment advice. It is not intended as an offer or solicitation for the purchase or sale of any financial instrument or as an official confirmation of any transaction. Opinions, estimates and assumptions expressed herein are made as of the date of this communication and are subject to change without notice. This communication has been prepared based upon information, including market prices, data and other information, believed to be reliable; however, Trade Nation does not warrant its completeness or accuracy. All market prices and market data contained in or attached to this communication are indicative and subject to change without notice.

U.S. Futures Slip as Fed Cut Bets Fade | US30 Holds Below 47460US30 | Overview
U.S. Futures Decline as Bets on a December Fed Rate Cut Recede
U.S. indices pulled back as traders scaled back expectations for a Federal Reserve rate cut in December, leading to mild risk-off sentiment across equity markets.
The Dow Jones (US30) continues to trade lower as investors await further economic data to gauge the Fed’s policy trajectory.
Technically:
The price has stabilized below the pivot line at 47460, confirming a bearish bias in the short term.
As long as the index trades below 47460, momentum favors a decline toward 47230 and 47080.
However, a 4H candle close above 47460 would invalidate this view and shift sentiment toward a bullish recovery targeting 47700 and 47850.
Pivot Line: 47460
Resistance: 47570 · 47700 · 47850
Support: 47230 · 47080 · 46920

Trading US30 DOW JONES: Bullish Momentum Here's My Trade PlanYesterday in my video 🎥, I mentioned that if US30 broke out to the upside, I'd look to enter long. That’s exactly what happened—big breakout! 🌟 Now, I’m waiting for a pullback 🕰️ to my optimal entry zone and a confirmed market structure shift for another buy opportunity 💵. (Not financial advice) 📝

US30 BEST PLACE TO SELL FROM|SHORT
US30 SIGNAL
Trade Direction: short
Entry Level: 48,294.2
Target Level: 47,472.1
Stop Loss: 48,842.3
RISK PROFILE
Risk level: medium
Suggested risk: 1%
Timeframe: 4h
Disclosure: I am part of Trade Nation's Influencer program and receive a monthly fee for using their TradingView charts in my analysis.
✅LIKE AND COMMENT MY IDEAS✅

BEARISH CONTINUATIONThe price is generally in a downtrend and buyers have retraced to the supply zone to accumulate more sell Orders. If buyers keep getting stronger there's a possibility to change character, But if SELLERS KEEP DOMINATING, ITS CLEAR THERE WILL BE A REVERSAL AT SUPPLY ZONE

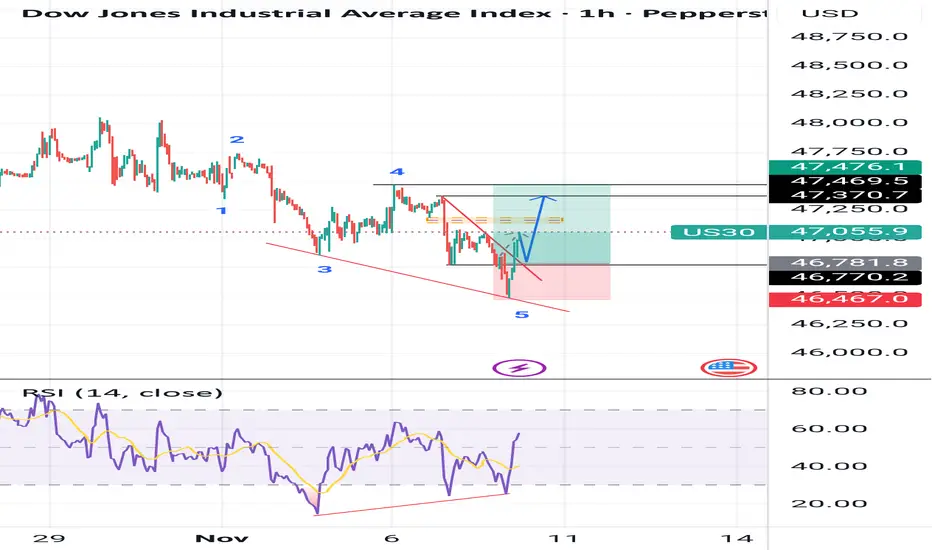
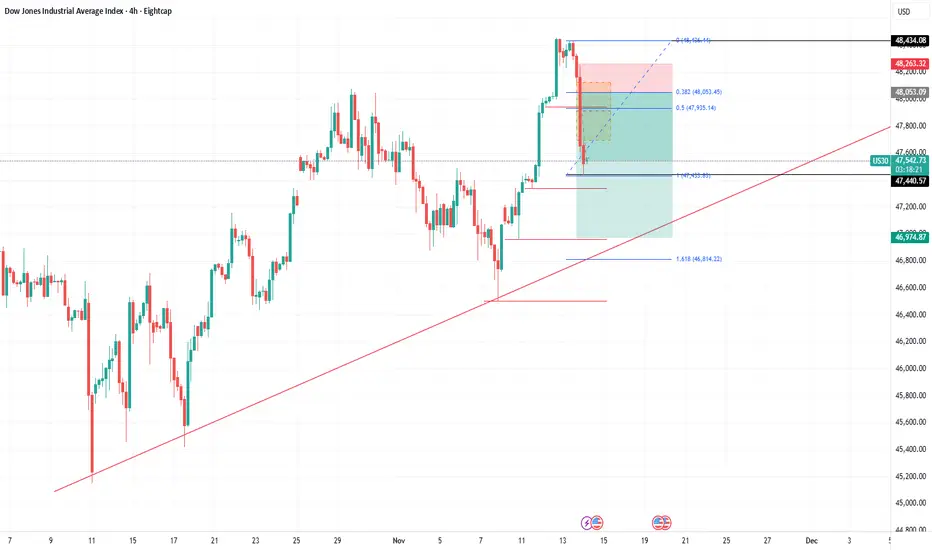
DJI : Starting from ZEROIt has been some time since I published the last DJI idea.
Anyway, price now is at the extreme and it is quite RARE that I have to start from ZERO - the beginning of EVERYTHING.
If this is the case, when I can clearly see the BEGINNING, then surely I can also see the END, with a DOUBLE 'D'.
It might just follow the previous drop of 38.2%
The probability is very good.
Good luck.

Dow Jones IndexThis week, the Dow Jones Index will maintain an upward trend, albeit at a slower pace compared to previous weeks. The short-term target will be met around the 48,160 level, and naturally, the market will reach that point. Following that, depending on market conditions, we will assess whether the upward trend will continue or if a decline will occur.

US30 Strategy: Waiting for Confirmation Amid Conflicting Trends🔥📉 Currently checking out the US30 (Dow Jones)! On the ⏰ 4-hour chart, the vibe is definitely bearish, but when you zoom out to the 📅 daily chart, things look much more bullish 🚀. For me, this index is at a real crossroads! 👉
🔎 On the 30-minute chart, I’m watching closely for a bullish breakout above the recent high and a key break of structure 🟢📈 — that would spark a potential buy opportunity!
💼 If instead, price slips below the current high and we see a bearish shift in structure 🚩📉, I’m eyeing a possible sell setup!
❗️Of course, this is just my view, not financial advice! 🚫💸

DOW JONES INDUSTRIAL HIGH PROBABILITY SETUP SOON!!!🚨 DOW30 HIGH PROBABILITY BUY SETUP 🚨
* Here We Can See Clearly The Next Potential Moves For US30 Coming Hours/Days.
* Keep Your Eyes Close On Your Trading Positions.
* Happy PIP Hunting Traders.
FXKILLA.

US30 showing signs of potential bullish momentumThe US30 index is currently in a phase of price consolidation, showing signs of potential bullish momentum. The recent strong upward movement indicates that buyers are regaining control, and there’s a possibility of further growth continuation if bullish momentum sustains.
On Wednesday, Wall Street’s main indices inched higher following a stronger-than-expected private payrolls report. Additionally, ongoing U.S. tariff court hearings boosted investor sentiment. Meanwhile, technology stocks stabilized after the previous session’s sharp sell-off, helping to support broader market optimism.
If the price reacts positively and rebounds strongly to the upside, we could expect the bullish trend to resume. The next psychological resistance level to watch would be around 47,800, which could act as a potential upside target for bullish traders.
You may find more details in the chart,
Trade wisely best of Luck Buddies.
Ps; Support with like and comments for better analysis Thanks for Supporting.

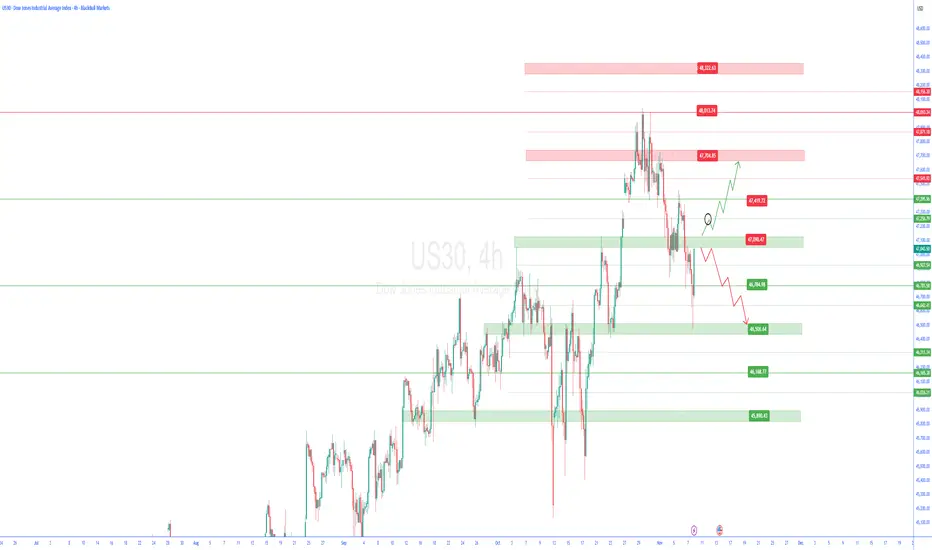
us30 4h🔹 Overall Outlook and Potential Price Movements
In the charts above, we have outlined the overall outlook and possible price movement paths.
As shown, each analysis highlights a key support or resistance zone near the current market price. The market’s reaction to these zones — whether a breakout or rejection — will likely determine the next direction of the price toward the specified levels.
⚠️ Important Note:
The purpose of these trading perspectives is to identify key upcoming price levels and assess potential market reactions. The provided analyses are not trading signals in any way.
✅ Recommendation for Use:
To make effective use of these analyses, it is advised to manually draw the marked zones on your chart. Then, on the 15-minute time frame, monitor the candlestick behavior and look for valid entry triggers before making any trading decisions.
Short idea on US30After a long rally, a small correction was due signaled strongly by RSI and Volume.
US30US30 AMD
Thursday Accumulation
Friday Manipulation & SSL purged into the daily upper quadrant wick @46,502.8
Failing to break lower
Friday internal range break of structure H1
Friday FVG Created & Breaker block overlapping FVG ( Remains Open )
Expecting to trade into the area of interest in the week ahead creating the Distribution

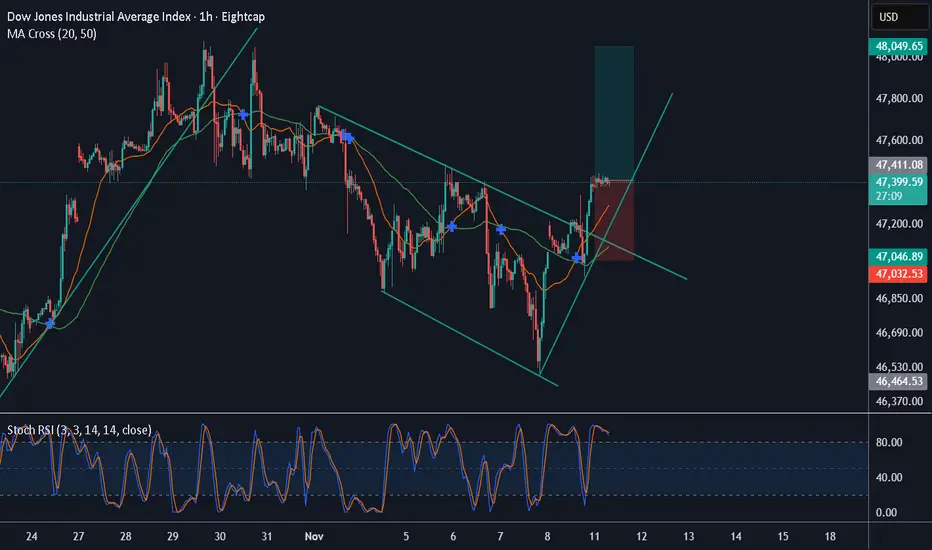
US30 - Entry Setups (1H Confirmation for Precision)Entry Setups (1H Confirmation for Precision)
Focus on price-action triggers at key levels. Use 1H for entries, 4H for context. All based on structure—no indicators.
Setup 1: Bullish – Buy the Support Bounce (Preferred, High Probability)
Rationale: Aligns with overall bull trend; 47,346.8 has held multiple times on 4H.
Entry Trigger: 1H bullish reversal candle (e.g., hammer or engulfing) at 47,346.8 (±20 points).
Entry Price: 47,350–47,370 (market or limit).
Stop Loss: 47,280 (below level + buffer; risk ~70 points).
Take Profits:
TP1: 47,523.2 (current 1H close) → +173 points.
TP2: 47,624.7 (prior 4H close) → +274 points.
TP3: 48,000 → +650 points.
Risk:Reward: 1:2.5–1:9.
Confluence: Strong volume on bounce; no 1H close below level.
Invalidation: 1H close <47,346.8 → switch to bearish setup.
Setup 2: Bearish – Short the Breakdown (If Triggered)
Rationale: Confirms short-term weakness if 1H/4H breaks support.
Entry Trigger: 1H close below 47,346.8, followed by retest from below (now resistance).
Entry Price: 47,330–47,340 (on retest rejection).
Stop Loss: 47,420 (above retest high; risk ~80 points).
Take Profits:
TP1: 47,000 → +340 points.
TP2: 46,987.3 → +353 points.
TP3: 46,527.3 → +813 points.
Risk:Reward: 1:4+.
Confluence: Increasing volume on drop; bearish 1H candles (e.g., marubozu).
Invalidation: Price reclaims >47,420 with bullish close → exit and flip long.
Follow me for more updates

Falling ChannelThe price formed a falling channel followed by a false breakout, pullback and now the price has broken out and looks go long
WE ONLY TRADE PULLBACKS
Comment your thoughts
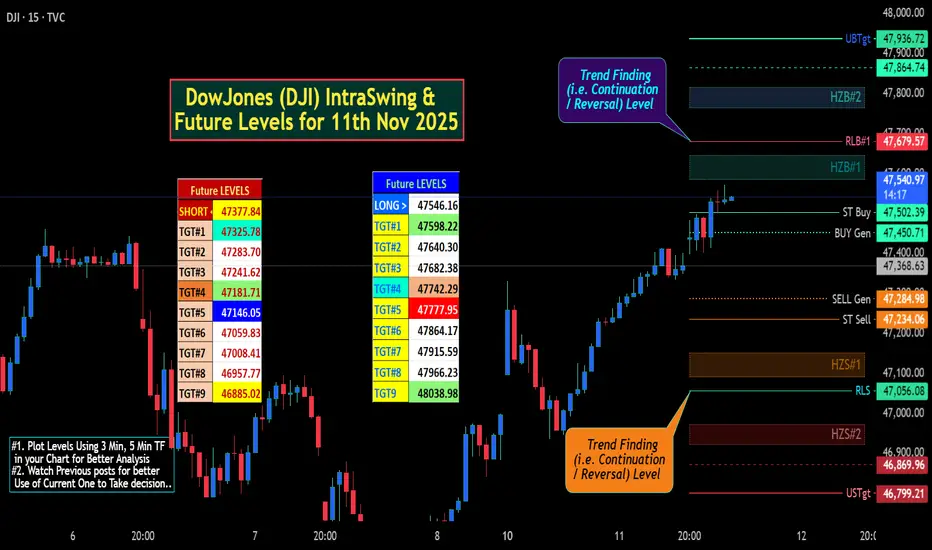
DowJones (DJI) IntraSwing & Future Levels for 11th Nov 2025✍🏼️ "Future IntraSwing Levels" mentioned in BOX format.
✍🏼️ "WEEKLY Levels" follow Sunday / Saturday's Post.
Useful to Tally / Recognize for Next day Trade Plan.
Useful to Tally / Recognize or sometime DETECT abnormal Movement of NIFTY for Next day Trade Plan.
Level description:
L#1: If the candle crossed & stays above the “Buy Gen”, it is treated / considered as Bullish bias.
L#2: Possibility / Probability of REVERSAL near RLB#1 & UBTgt
L#3: If the candle stays above “Sell Gen” but below “Buy Gen”, it is treated / considered as Sidewise. Aggressive Traders can take Long position near “Sell Gen” either retesting or crossed from Below & vice-versa i.e. can take Short position near “Buy Gen” either retesting or crossed downward from Above.
L#4: If the candle crossed & stays below the “Sell Gen”, it is treated / considered a Bearish bias.
L#5: Possibility / Probability of REVERSAL near RLS#1 & USTgt
HZB (Buy side) & HZS (Sell side) => Hurdle Zone,
*** Specialty of “HZB#1, HZB#2 HZS#1 & HZS#2” is Sidewise (behaviour in Nature)
Rest Plotted and Mentioned on Chart
Color code Used:
Green =. Positive bias.
Red =. Negative bias.
RED in Between Green means Trend Finder / Momentum Change
/ CYCLE Change and Vice Versa.
Notice One thing: HOW LEVELS are Working.
Use any Momentum Indicator / Oscillator or as you "USED to" to Take entry.
⚠️ DISCLAIMER:
The information, views, and ideas shared here are purely for educational and informational purposes only. They are not intended as investment advice or a recommendation to buy, sell, or hold any financial instruments. I am not a SEBI-registered financial adviser.
Trading and investing in the stock market involves risk, and you should do your own research and analysis. You are solely responsible for any decisions made based on this research.
"As HARD EARNED MONEY IS YOUR's, So DECISION SHOULD HAVE TO BE YOUR's".
Do comment if Helpful .
In depth Analysis will be added later (If time Permits)