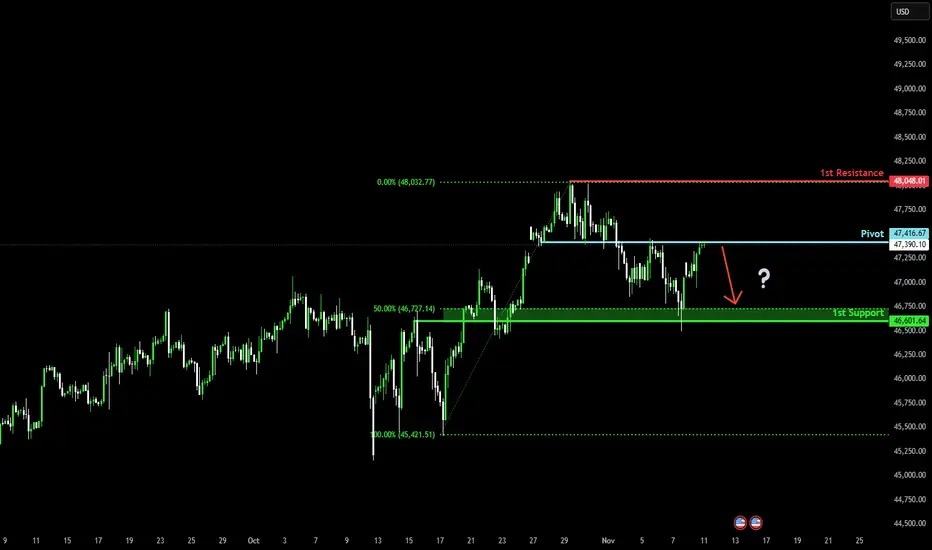
Could we see a reveral from here?Dow Jones (US30) is reacting off the pivot, which is an overlap resistance, and could reverse to the 1st support.
Pivot: 47,416.67
1st Support: 46,601.64
1st Resistance: 48,048.01
Disclaimer:
The above opinions given constitute general market commentary, and do not constitute the opinion or advice of IC Markets or any form of personal or investment advice.
Any opinions, news, research, analyses, prices, other information, or links to third-party sites contained on this website are provided on an "as-is" basis, are intended only to be informative, is not an advice nor a recommendation, nor research, or a record of our trading prices, or an offer of, or solicitation for a transaction in any financial instrument and thus should not be treated as such. The information provided does not involve any specific investment objectives, financial situation and needs of any specific person who may receive it. Please be aware, that past performance is not a reliable indicator of future performance and/or results. Past Performance or Forward-looking scenarios based upon the reasonable beliefs of the third-party provider are not a guarantee of future performance. Actual results may differ materially from those anticipated in forward-looking or past performance statements. IC Markets makes no representation or warranty and assumes no liability as to the accuracy or completeness of the information provided, nor any loss arising from any investment based on a recommendation, forecast or any information supplied by any third-party.
Trade ideas
US30 Day Trader Analysis US30 Day TraderAnalysis - 10 Nov 2025
Dow Jones 30 at 47,171 (4:30 PM UTC+4) — consolidation breakout setup forming.
📌 Market Context: Wyckoff Phase D accumulation post-October rally; Dow Theory primary uptrend intact with minor pullback; Gann Square-of-9 targets 47,600/46,800.
🗺️ Multi-Timeframe Pulse:
1D: Broadening wedge 46,800-47,500; RSI 61 (mild bearish divergence); Ichimoku cloud support 46,500; bullish pennant nearing breakout.
4H: Rising channel 47,000-47,400; EMA21>EMA50>EMA200 (golden cross); VWAP anchored Oct 1 = 46,950 (buy support).
1H: Cup-and-handle breakout base 47,050; BB expanding; VWAP slope bullish after morning dip test.
30M: Symmetrical triangle 47,100-47,250; hidden bull divergence on RSI; volume contracting pre-expansion.
15M: Bull flag above 47,120; Tenkan>Kijun bullish alignment; stochastic RSI reset ready for next leg.
5M: Falling wedge retest 47,140; hammer candlestick confirms demand; watch false breakout above 47,280.
🎯 PRIMARY LONG SETUP
Entry: 47,120-47,155 (triangle support + VWAP) — confirm on 15M bullish close >47,180.
Stop Loss: 47,050 (below triangle base).
Target 1: 47,250 (+80-130 pips).
Target 2: 47,400 (+230-280 pips — channel top).
Target 3: 47,550 (+400 pips — harmonic extension).
Confirmation: RSI>55, volume +20%, VWAP support holding.
⚡ MOMENTUM ADD: Scale above 47,400 ONLY if RSI>65 + volume surge; trail stop to 47,350.
🔻 REVERSAL SHORT SETUP
Entry: 47,500-47,600 (supply zone) — trigger on bearish engulfing + RSI divergence.
Stop Loss: 47,700 (above channel resistance).
Targets: 47,350 → 47,200 → 47,000 (Gann support).
Confirmation: 5M/15M RSI bearish divergence; BB upper band rejection.
🚨 BREAKOUT PROTOCOL:
BULL: 1H close >47,400 confirms wedge breakout; target 47,700; move stop to BE+20.
BEAR: 1H close <47,100 with volume expansion triggers retest 46,800 Gann support.
📊 INDICATOR SNAPSHOT: BB squeeze (30M) tightening; MACD histogram positive; VWAP slope up; EMA21 acting as trigger line on 1H.
⚠️ PATTERN ALERTS: Harmonic bat PRZ at 47,600; pennant breakout target aligns 47,550; channel failure <47,120 = Wyckoff spring risk; watch H&S if neckline 47,000 breaks.
📈 TIMING & VOLATILITY: US market close 21:00 UTC; earnings whispers elevate volatility; Gann 90° cycle 20:30 UTC. ATR(14) ≈150 pts expect 1.5% range. Risk ≤1% per setup; lock gains TP1; avoid chasing.
Educational analysis only. Align with your plan, manage risk diligently, adapt to live price action.

US30 Technical Breakdown – 11/10/2025📍 US30 Technical Breakdown – 11/10/2025
US30 is still trading within a wide consolidation range as price tests the mid-zone around 47,200–47,400. After last week’s dip toward 46,500, buyers stepped back in to defend structure — but momentum remains mixed. ⚖️
📊 Market Behavior:
🔹 Price reclaimed 47,000 support after a sharp bounce
🔹 EMAs converging → showing indecision / balance
🔹 Range remains between 46,500 – 47,400, with 48K still acting as the upper ceiling
📌 Key Levels:
🔹 Resistance:
47,400–47,410 → intraday supply zone
47,800 → minor reaction area
48,000 → strong psychological cap
🔹 Support:
47,000 → intraday structure
46,520 → range floor
45,550 → major swing low
🧠 Bias:
Neutral with slight bullish tilt 📈
⬆️ Break above 47,400 → opens road to 47,800–48,000
⬇️ Drop below 47,000 → could send price back toward 46,500

DOW JONES recovered and is looking for a High at 48500.Exactly 2 weeks ago (October 22, see chart below), we gave a strong Buy Signal on Dow Jones (DJI), as the index had already initiated the new Bullish Leg of its 6-month Channel Up and quickly hit our 47700 Target:
That trading plan included a 2nd Target as well at 48500, which represented a +7.50% rise from the October 10 Low, which was a Higher Low for the Channel Up on its 1D MA50 (blue trend-line).
As Target 1 was on the 1.382 Fibonacci extension, the recent pull-back was technically expected as the sequence was similar to those of August 22 - September 02 among others. As you can see, all minor pull-backs that took place within this Channel Up, hit the 4H MA100 (red trend-line) and rebounded. Major ones found support lower on the 1D MA50, as did the October 10 Low.
Since the index hit yesterday its 4H MA100 and is rebounding today, the Bullish Leg remains valid and on the medium-term can reach our final 48500 Target.
-------------------------------------------------------------------------------
** Please LIKE 👍, FOLLOW ✅, SHARE 🙌 and COMMENT ✍ if you enjoy this idea! Also share your ideas and charts in the comments section below! This is best way to keep it relevant, support us, keep the content here free and allow the idea to reach as many people as possible. **
-------------------------------------------------------------------------------
💸💸💸💸💸💸
👇 👇 👇 👇 👇 👇

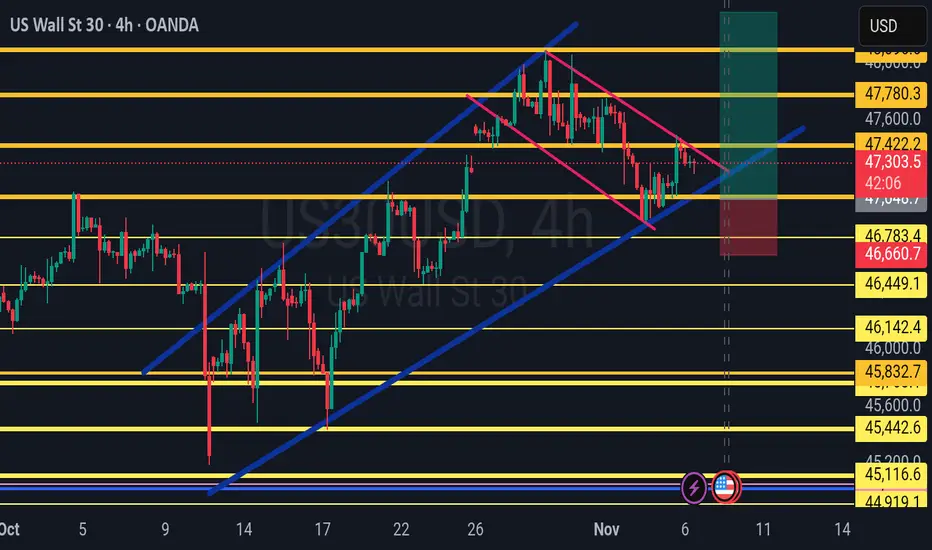
US30US30 is almost completing correction before further upside follows.
Disclosure: We are part of Trade Nation's Influencer program and receive a monthly fee for using their TradingView charts in our analysis.

Golds overperformance relative to the Dow will be dramatic !!The place to invest during the following decade is gold!!
The Dow Jones is projected to lose 96% relative to gold from now until August 2036!! (if history repeats itself as it did in 1968-1980).
In 12 years time, the DOW to GOLD ratio is expected to reach 0.44.
By 2026, we will be able to sell our gold by buying the Dow with less than half an ounce of gold (currently, it takes 12 ounces of gold to buy the Dow).
We're talking about a 24x outperformance!!
DO NOT ignore the historic break down in the stock market relative to gold which is happening right now !! For those who think that the gold bull is over: it is just about to start !!
This is a ratio graph, so don't get me wrong: the DOW could still hit 100'000 USD but that would imply that Gold would rise above 100'000 USD an ounce !

US30 BULLHI
Simple market structure.
The chart speaks for itself
Quick resume, the market is currently goin through correction for bullish continuation.

US30(SHORT)
Us30 resecting trendline.
Rejected at resistance of trendline.
Expecting long term shorts

US30 Trade Set Up Nov 4 2025Price pushed down hard during Asia and London and is making bearish structure so i will be looking for sells either after a sweep of BSL and tap into 4h FVG or if we invert this 15m FVG with a retest i will take sells down to SSL/London lows and lower 4h FVG

US30 – Correction Toward 47100 | Next Leg Up Toward 47920US30 – MARKET OUTLOOK | Bullish Bias Above 47100
US30 is showing a mild bearish correction after facing resistance near 47460, but the broader structure remains bullish while price holds above 47100.
🔼 Above 47460: Bullish continuation toward 47750 → 47920 → 48200.
🔽 Below 47100: Bearish correction possible toward 46920 → 46600.
Pivot: 47430
Support: 47100 · 46920 · 46600
Resistance: 47750 · 47920 · 48200
US30 stays bullish while above 47100, but a confirmed close below this level could trigger a short-term bearish correction toward 46920.

US30 LONG SETUP Price is looking to test 48.000 again after a strong correction that pushed it back to 47. region. Healthy support around 47 has been met on point with the 50% fib level. Strong push back to 48 is promising.
Dow Challenges 4-Year ResistanceFrom a monthly perspective, and filtering out short-term noise using the line chart, the Dow’s price action has been contracting since its bullish rebound from the 2020 lows, with overbought momentum previously recorded in November 2024 and April 2021.
This setup highlights the potential for long-term reversal risks near the upper boundary — specifically along the trendline connecting consecutive higher highs from November 2021 through November 2024.
If the trend extends beyond the 48,000 resistance, further advances could target 48,400 and 49,000, with 51,000 seen as an extreme projection before another major correction phase.
Conversely, a confirmed hold below 46,900 would indicate renewed pressure, potentially driving prices toward 46,600 and 46,200, where a technical rebound could occur.
If not, a deeper retracement toward the 45,000 region (previous significant resistance of 2025) may emerge.
Written by Razan Hilal, CMT

us30bias: sell
setup EW (Ride Wave 5)
EP: fvg-h4 (pening US Open)
SL: Previous Daily High
TP: Previous Daily Low

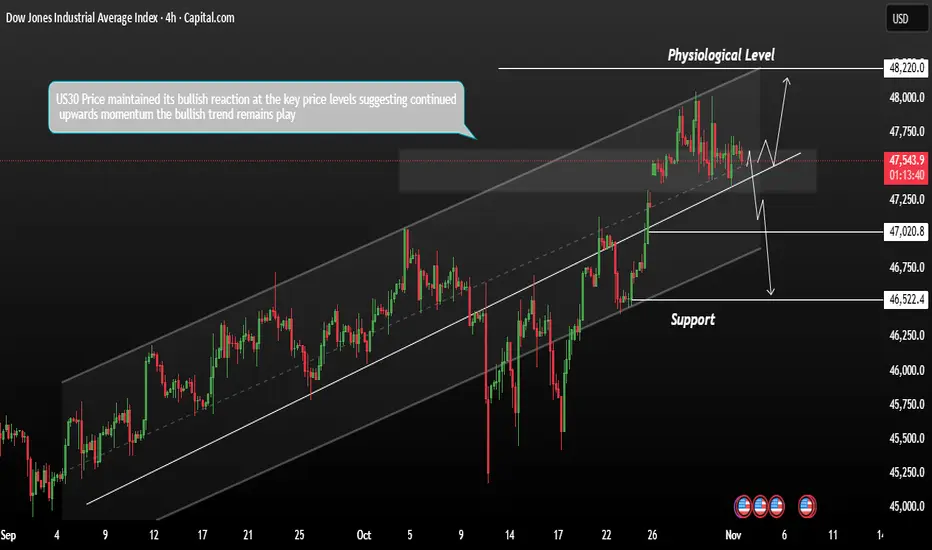
US30 Technical Outlook – Bullish Momentum IntactThe US30 maintained its bullish reaction at key price levels, suggesting continued upward momentum. As November begins, the index futures gained on Monday, supported by optimism around U.S.–China trade relations and stronger demand sentiment.
Currently, the bullish trend remains in play. If price continues to react positively to current support zones, we could see a potential move toward the next major psychological resistance level at 48,220.
However, if price fails to hold above current levels and we see a bearish reaction, a pullback could be triggered toward the support area between 47,030 and 46,520.
You may find more details in the chart.
Trade wisely best of Luck Buddies,
Ps; Support with like and comments for better analysis Thanks for Supporting.
BUY NOW US30!!!!!US30 made a strong price rejections off my poi after a wild moves in the market yesterday am looking forward to see price made a strong pull back up to 48k trend is still bullish we just closed a gap without taking out our internal structure lows....

us30Dow Jones on the 4H timeframe is moving in a downtrend in my view. Based on the data on the chart, it’s time for a correction. The price may rise to the highlighted area 1 hour timeframe before continuing the corrective targets shown on the chart, or it may complete the correction around the 50% Fibonacci retracement level. It’s unlikely to rise beyond that level."

US30 Risky Short!
HI,Traders !
#US30 is growing now
But a horizontal resistance
Level of 47513.8 from where
We will be expecting a local
Pullback and a local move down !
Comment and subscribe to help us grow !

US 30Preferably suitable for scalping and accurate as long as you watch carefully the price action with the drawn areas.
With your likes and comments, you give me enough energy to provide the best analysis on an ongoing basis.
And if you needed any analysis that was not on the page, you can ask me with a comment or a personal message.
Enjoy Trading ;)

US30 BUY WITH LIMIT ORDER!!!!!US30 made a strong rejections off the order block zone am going to be positioning for a buy entry on the pull back in the inside bar candle on the buy zone i marked....

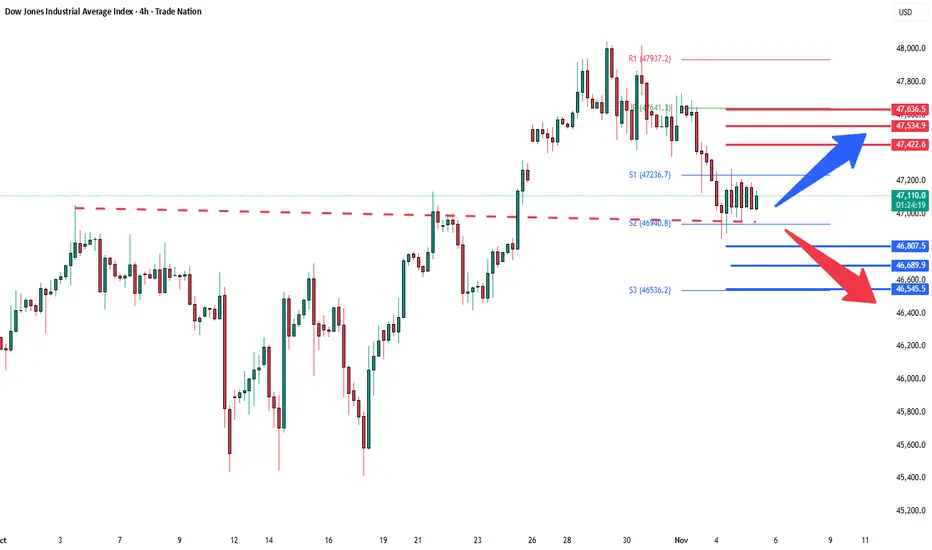
DowJones strong support retest Key Support and Resistance Levels
Resistance Level 1: 47433
Resistance Level 2: 47534
Resistance Level 3: 47636
Support Level 1: 46807
Support Level 2: 46690
Support Level 3: 46545
This communication is for informational purposes only and should not be viewed as any form of recommendation as to a particular course of action or as investment advice. It is not intended as an offer or solicitation for the purchase or sale of any financial instrument or as an official confirmation of any transaction. Opinions, estimates and assumptions expressed herein are made as of the date of this communication and are subject to change without notice. This communication has been prepared based upon information, including market prices, data and other information, believed to be reliable; however, Trade Nation does not warrant its completeness or accuracy. All market prices and market data contained in or attached to this communication are indicative and subject to change without notice.

US30 Trade Set Up Nov 3 2025For price to go bullish i want to see a test of the 15m FVG and respect it to then make internal 1m-5m IFVG/CISD to target BSL/London highs but if price inverts the 15m gap i will look for sells to PDL

