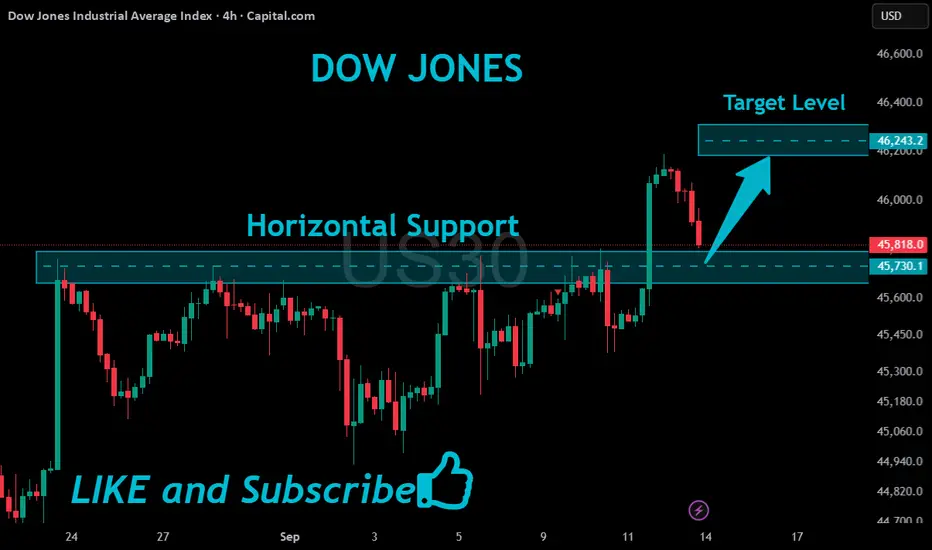
US30 In Support Below!
HI,Traders !
#US30 is trading in an
Uptrend and is
Now making a local bearish
Correction to retest the
Horizontal support below
Around 45730.1 from where
We will be expecting a
Further bullish move up !
Comment and subscribe to help us grow !
DJ30.F trade ideas
US30Success in forex and stocks comes from a combination of knowledge, discipline, and patience. Understanding market trends, economic factors, and company
fundamentals is crucial, but equally important is controlling emotions and sticking to a well-planned strategy. Continuous learning, adapting to changing conditions, and managing risk wisely can turn opportunities into consistent growth over time.
Consistency, not luck, separates successful traders from the rest.

US30 AnalysisI expect US30 to remain bearish this week. Current price action suggests weakness, with momentum favoring sellers. If market conditions hold, we may see a continuation to the downside, and today’s session is also likely to close bearish. A short position looks favorable at this point, but as always, risk management is key.
Dow Jones: Market Ready for a New Upward ImpulseMarket Overview:
The Dow Jones Index is holding above the key support zone of 45,100–45,200, forming a bullish structure. After a consolidation phase, the index is showing signs of an upside breakout.
Technical Signals:
Fibonacci levels point to potential growth toward 46,100, 46,350, and 46,700.
EMA 144 supports the bullish scenario, staying below the current price.
AO indicator is turning positive, confirming strengthening bullish momentum.
Key Levels:
Support: 45,100 – 45,200
Resistance: 46,100 – 46,700
Scenario:
The main scenario remains bullish — if the index consolidates above 45,600, we expect growth toward 46,100–46,700. The alternative scenario is a breakdown below 45,100, which could lead to a move toward 44,800.

US30 LONG/BUY Hello there
Looks like a high probability trade is forming on US30
1. Regular flat formation
2. MACD divergence 1HR TF forming
3. 3 WAVE corrective structure
4. 61.8 FIB retracement of impulsive move
Strategy: Entry at 61.8 FIB retracement entry
Entry: Current Market Price/ 45641 (little gap left)
Stop Loss: 45391
Take Profit: 46300
Trade with care
God Bless you

US30 – Rejected at 46,145, Holding Above 45,700 SupportThe Dow Jones Index faced rejection near the 46,145 resistance and is now pulling back toward the 45,700 support zone. Price action here will determine whether buyers can sustain momentum or if sellers push lower.
Support at: 45,700 / 45,000 / 44,000 🔽
Resistance at: 46,145 🔼
🔎 Bias:
🔼 Bullish: Holding above 45,700 could lead to another retest of 46,145, with a breakout opening room for higher highs.
🔽 Bearish: A break below 45,700 would shift focus toward 45,000, and further weakness could target 44,000.
📛 Disclaimer: This is not financial advice. Trade at your own risk.

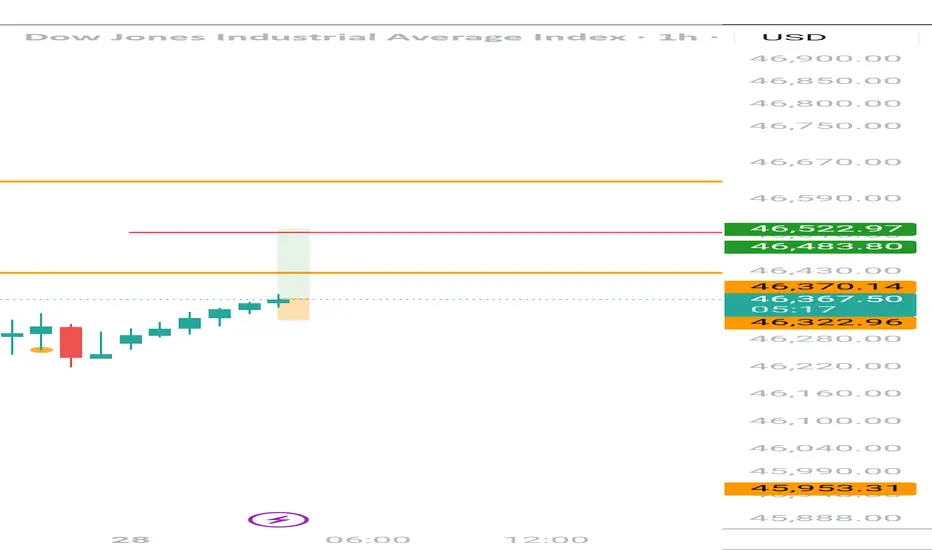
US30 Consolidates Ahead of Fed – Key Range 46,000 to 45,680US30 – Technical Overview
The Dow Jones continues to consolidate between 46,000 and 45,680 as traders await the Federal Reserve’s rate decision later this week.
Markets largely expect a 25 bps cut, but the key driver will be Chair Powell’s guidance on inflation, labor-market softness, and tariff risks—factors that could spark a breakout from the current range.
Technical Outlook
📉 Support test
Price remains inside a consolidation zone and is expected to retest 45,680 before attempting a rebound.
📈 Bullish continuation
A bounce from support could drive price back to 46,000, with a breakout above this level targeting 46,125.
A sustained move above 46,125 would open the path for a new ATH near 46,250 → 46,430, especially if the Fed signals a more dovish stance.
Key Levels
Pivot: 45,910
Resistance: 46,000 – 46,125 – 46,250
Support: 45,680 – 45,500
previous idea:

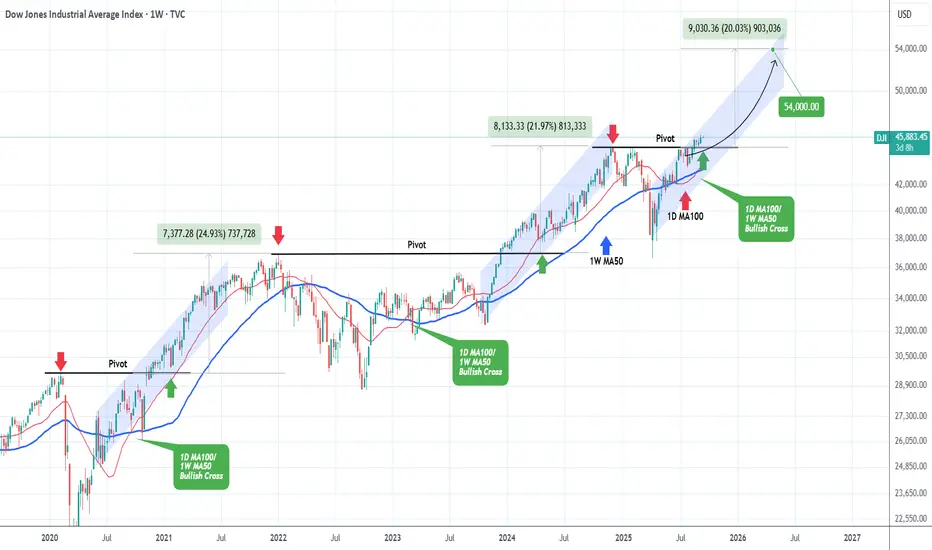
DOW JONES The Cyclical Pivot that MUST hold.Last week (Sep 03, see chart below) we gave a buy signal on Dow Jones (DJI) right at the bottom of its medium-term Channel Up, which quickly hit our 46100 Target:
This time we switch to a much wider and longer term outlook on the 1W time-frame as we are just a day before the Fed Rate Decision. The index has been trading within a strong Channel Up ever since the April 07 2025 market bottom, product of the Trade War correction early in 2024.
The 1D MA100 (red trend-line) crossed above the 1W MA50 (blue trend-line) forming a peculiar Bullish Cross, which interestingly enough, it is the 3rd time we see it since September 2020.
As a result, it is highly critical and as you can see, after such cross, the 1W MA50 has historically led the index higher.
What is perhaps even more critical however is the Pivot trend-line, which is essentially the former All Time High (ATH) turned into Support for the Channel Up pattern that have pushed the market higher since 2020.
As you can see, that level always held and the two rallies that we've had on the pattern like the current one, completed +25% and +22% rallies above it before an eventually correction that broke below the 1W MA50.
As a result, we could see another +20% rise at least, translating into a 54000 long-term Target, as long as both the 1W MA50 and the Pivot hold.
-------------------------------------------------------------------------------
** Please LIKE 👍, FOLLOW ✅, SHARE 🙌 and COMMENT ✍ if you enjoy this idea! Also share your ideas and charts in the comments section below! This is best way to keep it relevant, support us, keep the content here free and allow the idea to reach as many people as possible. **
-------------------------------------------------------------------------------
💸💸💸💸💸💸
👇 👇 👇 👇 👇 👇
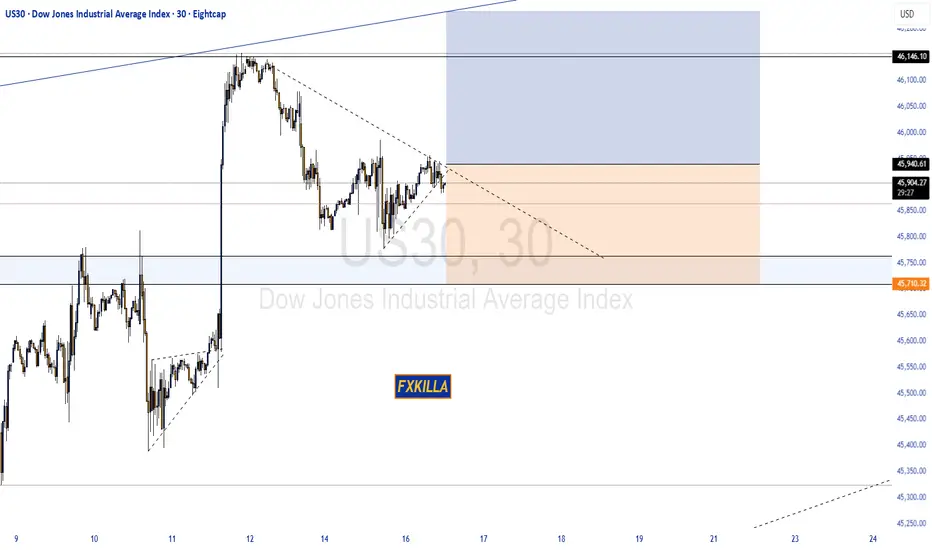
DOW JONES HIGH PROBABILITY SETUP SOON!!!🚨 US30 HIGH PROBABILITY BUY SETUP 🚨
* Here We Can See Clearly The Next Potential Move For DOW30 Coming Hours.
* Keep Your Eyes Close On Your Trading Positions.
* Happy PIP Hunting Traders.
FXKILLA.
US30 – Bearish Below 46,300 With Downside Targets at 46,120 US30 – Overview
US30 is holding a bearish bias after stabilizing below 46,300.
As long as price trades below the pivot, the index is expected to extend the decline toward 46,120, with a further drop to 46,000 possible.
A confirmed 1H close below 46,000 would strengthen the bearish trend and expose deeper support at 45,690.
On the other hand, a 1H close above 46,300 would neutralize the bearish pressure and support a rebound toward 46,400 – 46,470.
Pivot: 46,300
Support: 46,120 – 46,000 – 45,690
Resistance: 46,400 – 46,470 – 46,620

possibility of uptrend The index is expected to consolidate above the support level and then start an upward trend.
Otherwise, a downward trend will form and the support level will be broken.

Volume profile indicator Volume Profile is an advanced charting tool that displays trading activity (volume) over a specified period at specified price levels
Volume Profile plots a histogram on the chart to show significant price levels based on volume (typically daily or weekly sessions)

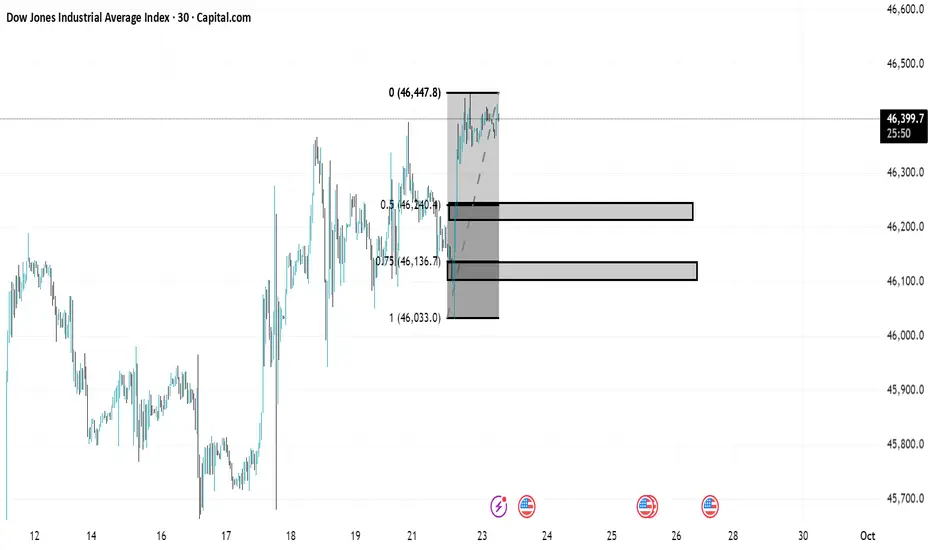
US30 TREND ANALYSISIn US30 there is a clear uptrend important areas are marked as always one is 50 percent area and the other one is 75 percent area .Once the market comeback for retest we will shift to smaller timeframe and look for trendshift after observing everything. When the market again comeback for the retest on smaller timeframe we will look for buy side trade.
important areas
50 percent zone(46245.3)
75 percent zone(46134.3)
bigger timeframe (30 minutes)
smaller timeframe(5 minutes)
#DJI - Pivot Point is 45258Date: 09-09-2025
#DJI - Current Price: 45515
Pivot Point: 45258
Upside Resistance Levels:
Resistance 1: 45796
Resistance 2: 46147
Resistance 3: 46498
Resistance 4: 46964
Resistance 5: 47429
Downside Support Levels:
Support 1: 44723
Support 2: 44371
Support 3: 44018
Support 4: 43553
Support 5: 43088
#TradingView #Nifty #BankNifty #DJI #NDQ #SENSEX #DAX #USOIL #GOLD #SILVER

Us30 - bullish push before a big DropI see US30 rising another 150 points before a possible pullback.
US30 A Fall Expected! SELL
My dear subscribers,
My technical analysis for US30 is below:
The price is coiling around a solid key level - 46250
Bias - Bearish
Technical Indicators: Pivot Points High anticipates a potential price reversal.
Super trend shows a clear sell, giving a perfect indicators' convergence.
Goal - 46113
My Stop Loss - 46325
About Used Indicators:
By the very nature of the supertrend indicator, it offers firm support and resistance levels for traders to enter and exit trades. Additionally, it also provides signals for setting stop losses
Disclosure: I am part of Trade Nation's Influencer program and receive a monthly fee for using their TradingView charts in my analysis.
———————————
WISH YOU ALL LUCK

US30: 50K MAGNET ACTIVATED! Historic Breakout Loading# 🚀 US30: 50K MAGNET ACTIVATED! Historic Breakout Loading 📊
Current Price: 49,269.7 | Date: Sept 27, 2025 ⏰
📈 INTRADAY TRADING SETUPS (Next 5 Days)
🎯 BULLISH SCENARIO
Entry Zone: 49,200 - 49,300 📍
Stop Loss: 49,000 🛑
Target 1: 49,600 🎯
Target 2: 49,850 🚀
🎯 BEARISH SCENARIO
Entry Zone: 49,350 - 49,400 📍
Stop Loss: 49,500 🛑
Target 1: 48,900 🎯
Target 2: 48,650 📉
🔍 TECHNICAL ANALYSIS BREAKDOWN
📊 KEY INDICATORS STATUS:
RSI (14): 64.8 ⚡ *Bullish Momentum Zone*
Bollinger Bands: Upper Band Squeeze 🔥
VWAP: 49,180 - Strong Support Base 💪
EMA 20: 49,150 ✅ *Golden Cross Active*
Volume: Above Average 📊 *Institutional Flow*
🌊 WAVE ANALYSIS:
Elliott Wave: Wave 3 Extension in Progress 🌊
Fibonacci Target: 50,200 (161.8% Extension) 🎯
🔄 HARMONIC PATTERNS:
Bullish Cypher Completion at 49,100 ✨
Gartley PRZ Active - 49,050 Zone 🔄
⚖️ SWING TRADING OUTLOOK (1-4 Weeks)
🚀 BULLISH TARGETS:
Psychological: 50,000 🏆
Weekly Target: 50,300 🌙
Gann Square: 50,625 ⭐
📉 BEARISH INVALIDATION:
Weekly Support: 48,800 ⚠️
Critical Break: 48,500 🚨
🎭 MARKET STRUCTURE:
Trend: Strong Bullish Impulse 💪
Momentum: Accelerating 🔥
Wyckoff Phase: Mark-up Phase 📈
Ichimoku: All Systems Green 🟢
🏆 HISTORIC LEVELS:
50K Psychological: Major Magnet 🧲
All-Time High: 49,450 (Breaking Soon!) 💥
Monthly Pivot: 49,100 Support 🛡️
⚡ RISK MANAGEMENT:
Max Risk per Trade: 1% 🛡️
R:R Ratio: Minimum 1:3 ⚖️
Trailing Stops: Every 200 points 📏
🌍 MARKET CATALYSTS:
Economic Data Supporting Rally 📈
Corporate Earnings Momentum 💼
Fed Policy Tailwinds Continue 🏛️
🔥 CRITICAL WATCH ZONES:
Breakout: 49,350 confirmed close 💥
Support: 49,100 | 48,950 | 48,800 🛡️
Resistance: 49,500 | 49,750 | 50,000 🚧
🎯 FINAL VERDICT:
US30 poised for HISTORIC BREAKOUT to 50K! 🚀
Multiple confluences aligning perfectly! 💯
Bull flag formation targeting new ATH! 📈
Trade Management: Buy dips to VWAP support 💎
Key Level: Hold above 49,100 crucial 🔑
---
*⚠️ Disclaimer: Trading involves significant risk. Use proper position sizing. Educational purposes only.*
For individuals seeking to enhance their trading abilities based on the analyses provided, I recommend exploring the mentoring program offered by Shunya Trade. (Website: shunya dot trade)
I would appreciate your feedback on this analysis, as it will serve as a valuable resource for future endeavors.
Sincerely,
Shunya.Trade
Website: shunya dot trade
🔔 Follow for Live Updates | 💬 Drop Your 50K Predictions Below

Dow Jones Industrial to 65kFrom the fib extension and intersection with upper channel, let's see
Not financial advice

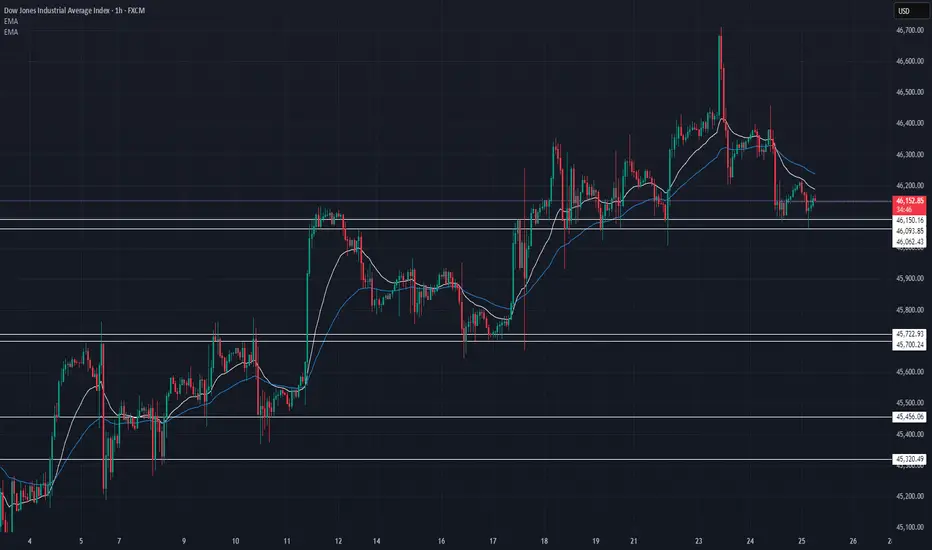
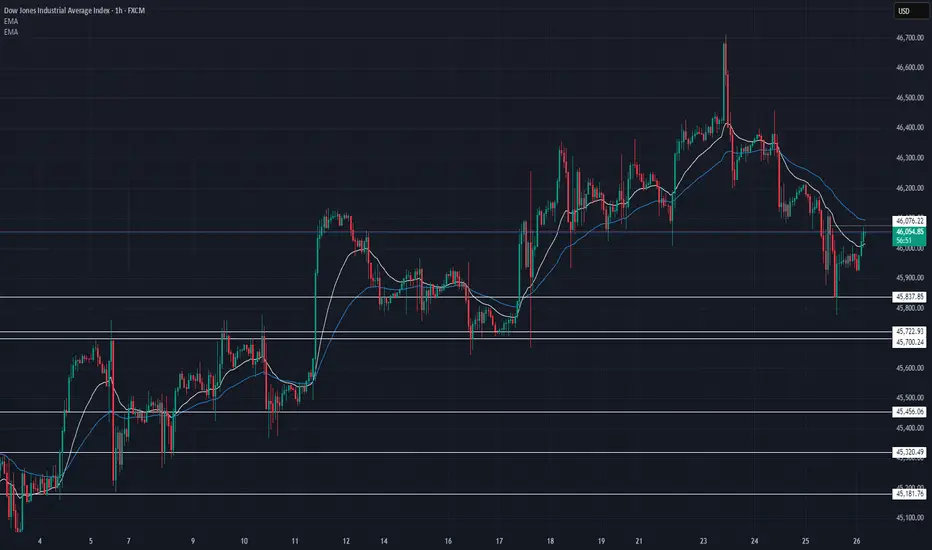
US30 Technical Breakdown – 09/26/2025📍 US30 Technical Breakdown – 09/26/2025
Dow Jones pulled back from its 46,650 peak and dipped under 46,000, now retesting the 46,050 zone. Momentum has shifted bearish short-term, but bulls defending key supports could spark a bounce.
📊 Market Behavior:
🔹 Sharp rejection from recent highs
🔹 EMA crossover showing weakness ⚠️
🔹 Buyers stepping in at 45,800–45,700
📌 Key Levels:
🔹 Resistance Zones:
46,100 → intraday test zone
46,300 → breakout confirmation
46,650 → major top
🔹 Support Zones:
45,837 → first demand
45,722 → key pivot support
45,456 → deeper retracement
45,181 → strong buffer
🧠 Bias:
Short-term bearish 🔴
Holding 45,700 keeps mid-term bullish case alive.
US30 Technical Analysis 1 Hour chart 📉 US30 Technical Analysis (1H Chart)
US30 is currently trading at 45,936 and remains inside a well-defined descending channel, showing strong bearish momentum.
• Trend: Price broke below the previous support (around 46,105 – 46,133) and retested it as resistance, confirming bearish continuation.
• Entry Zone: The rejection candle around the retest zone suggests sellers are still in control.
• Target Levels:
• First support: 45,911
• Next bearish target zone: 45,774 – 45,590 (lower channel support)
• Invalidation: A clean break and 1H close above 46,133 would invalidate the bearish setup and open room for bullish correction.
👉 Bias remains bearish as long as price stays under 46,100. Short-term downside continuation expected toward 45,700 – 45,600.

US30 Technical Breakdown – 09/25/2025📍 US30 Technical Breakdown – 09/25/2025
US30 dipped into the 46,100–46,000 support zone and held. Buyers stepped in right at demand, keeping the structure intact ✅.
📊 Market Behavior:
🔹 Strong defense of 46K support
🔹 Consolidating after rejection near 46,700
🔹 Bulls need 46,300+ reclaim for momentum
📌 Key Levels:
🔹 Resistance Zones:
46,300 → First hurdle for buyers
46,430 → Short-term breakout trigger
46,700 → Major top to break
🔹 Support Zones:
46,150 → Current intraday support
46,000 → Must hold for bulls
45,722 → Strong demand area
🧠 Bias:
Neutral → leaning bullish 🟢
Above 46K = healthy structure
Break below 45,700 = bearish shift ⚠️