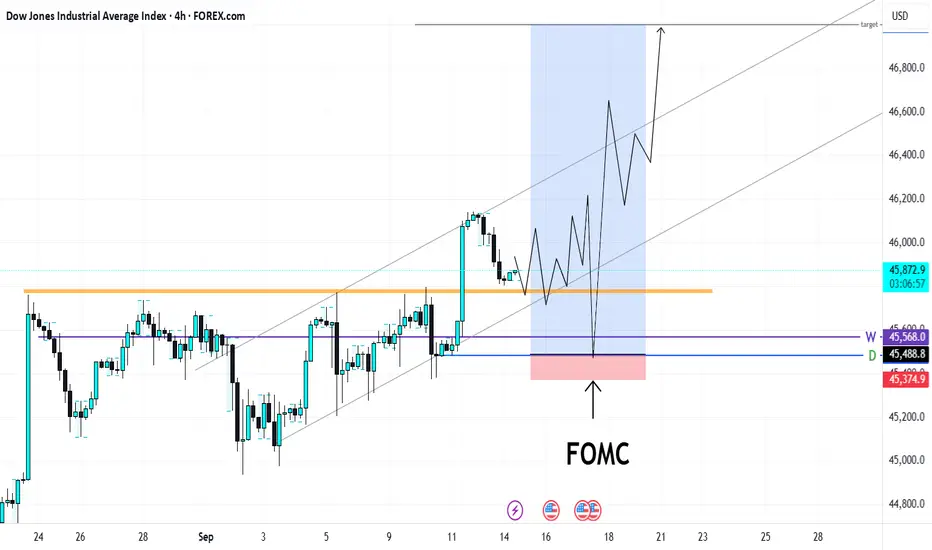
Dow Jones - FOMC idea: LONG to 47,000Fundamentals
I don't think it is good idea to be selling the dollar any longer but it's still good to be long on equities indexes.
There's a guaranteed rate cut of -0.25% from the Federal Reserve on Wednesday. Lowering interest rates means more people are going to borrow. More people spending, more businesses thriving, stocks go up, index go up. There are two more cuts to be expected for 2025 and that is what smart money is pricing in. That is the expectation. The Fed has chosen the labor market over inflation issue. The surprise here would be if the Fed changes its focus to inflation. Which could stun or drop the indexes. That is unlikely that is why it is high probability long.
Technical
It's too early to tell right now, how the price action is going to be. If price action changes on tuesday, I'm going to be doing the same thing. That is to find liquidity of bandwagon buyers, at an obvious break and retest support. Below that where stops and sell stops is I estimate where the discounted smart money longs would be. That is 45,500
I will not be putting a buy limit until Wednesday London session that is if price action remains the same
DJ30.F trade ideas
Us30what ya think?
easy break n re-test
i got nothing else to say lol
its up trend and kept going up back and the same support it was trying to break when it was resistance

Too clear too easy We'll be patient with this one. Once price reach to our POi, dropp down to lower timeframe to find precise entry, worthy the wait. #us30
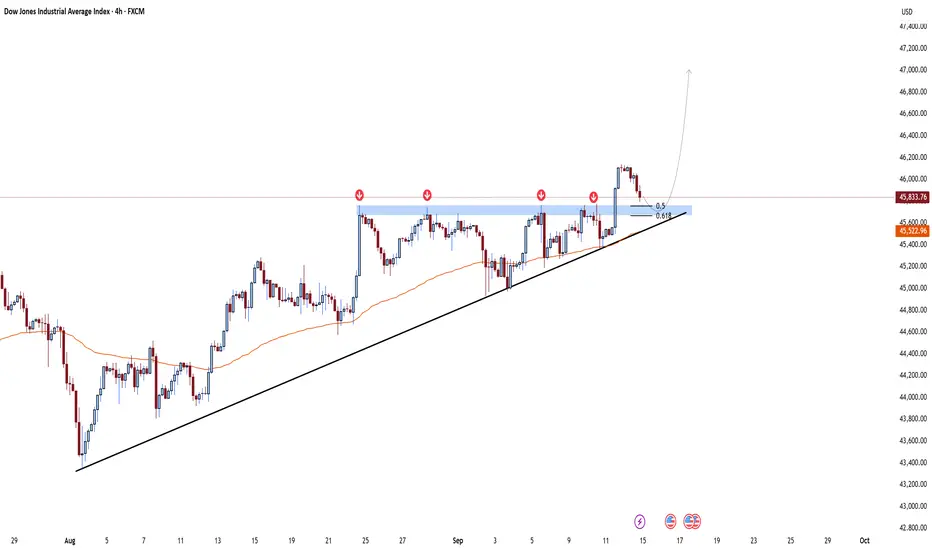
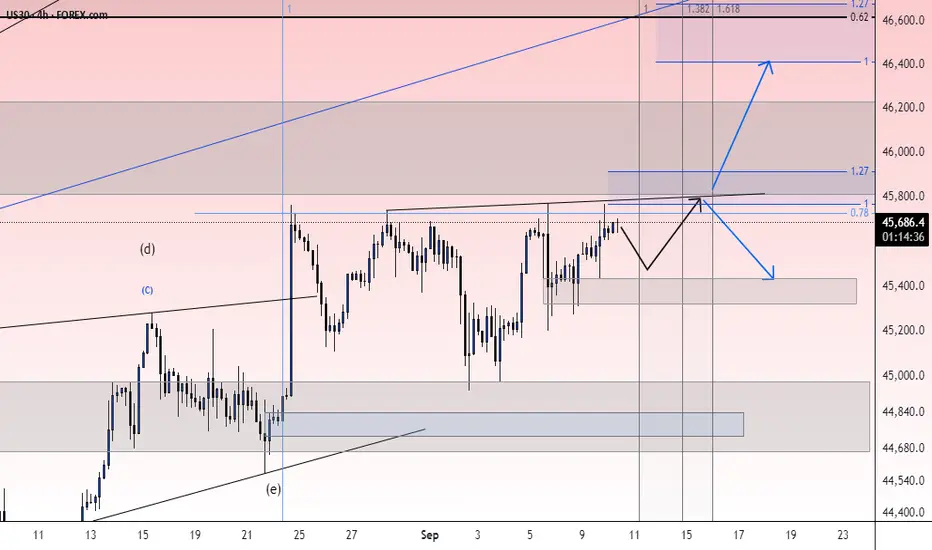
US30 4H📊 Dow Jones (4H) Analysis
The Dow just broke through the 45,700 resistance and is now pulling back to retest that same level as support.
✅ Key points:
The 45,700 zone, which acted as resistance before, could flip into strong support now.
Fibonacci retracements (0.5 & 0.618) line up right in this area, adding more confluence.
The ascending trendline and moving average are also sitting below price, keeping the bullish structure intact.
🎯 Targets:
Short-term: 46,200 – 46,400
Medium-term (measured move from the ascending triangle): 47,000 – 47,200
⚠️ Invalidation:
If price loses the 45,500 – 45,600 zone, we could see a deeper correction back to 45,000 – 45,200.
---
📌 Summary:
As long as the pullback into 45,700 holds, the bullish scenario stays in play and higher targets remain on the table.
---
🔥 What do you think? Is this just a clean retest before a push to 47,200, or will the Dow drop back below support?
us30 4hTrading Outlooks for the Week Ahead
In this series of analyses, we review short-term trading outlooks and perspectives.
As can be seen, in each analysis there is a key support/resistance zone close to the current price of the asset. The market’s reaction to or breakout from these levels will determine the next price movement toward the specified targets.
Important Note: The purpose of these trading outlooks is to highlight critical price levels ahead and the market’s potential reactions to them. The analyses provided are by no means trading signals!

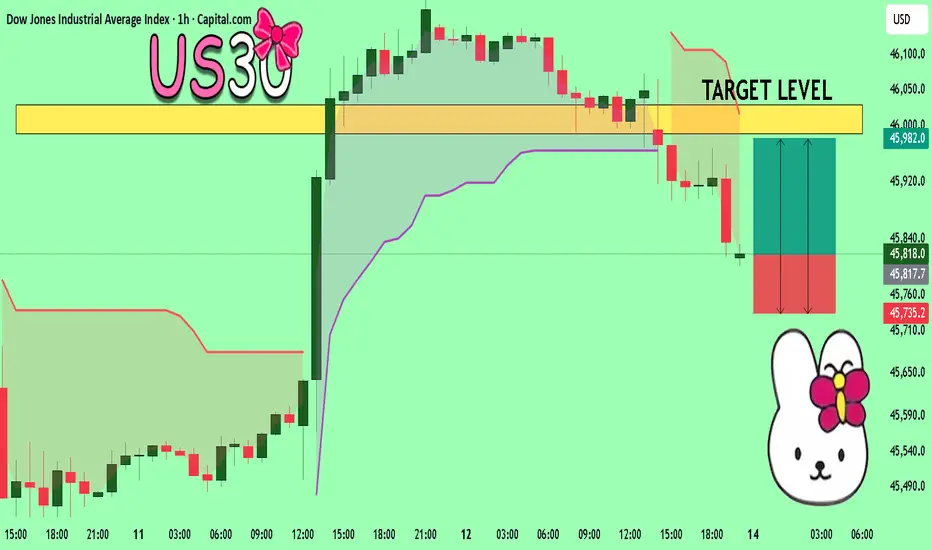
US30 Will Explode! BUY!
My dear friends,
Please, find my technical outlook for US30 below:
The price is coiling around a solid key level - 45818
Bias - Bullish
Technical Indicators: Pivot Points Low anticipates a potential price reversal.
Super trend shows a clear buy, giving a perfect indicators' convergence.
Goal - 45988
Safe Stop Loss - 45735
About Used Indicators:
The pivot point itself is simply the average of the high, low and closing prices from the previous trading day.
Disclosure: I am part of Trade Nation's Influencer program and receive a monthly fee for using their TradingView charts in my analysis.
———————————
WISH YOU ALL LUCK
Weekly Forex Outlook Sun.Sept.14.2025 - Fri.Sept.19.2025Like and Comments would be appreciated :D Not Financial Advice, Just my outlook/opinion

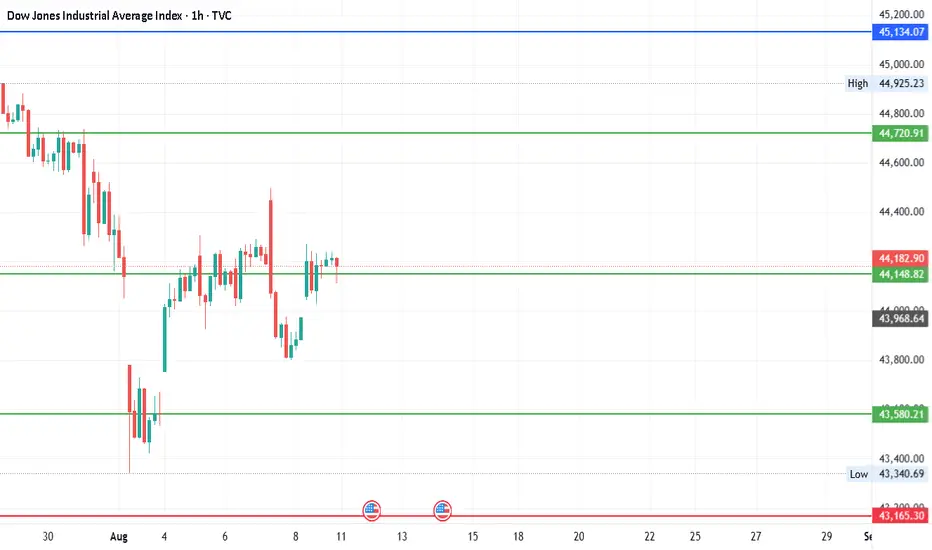
#DJI - Levels for Aug 2025Date: 09-08-2025
#DJI - Current Price: 44175.61
Pivot Point: 44149 Support: 43580 Resistance: 44721
#DJI Upside Targets:
| 🎯 Target 1 | 45134 |
| 🎯 Target 2 | 45547 |
| 🎯 Target 3 | 46072 |
| 🎯 Target 4 | 46596 |
#DJI Downside Targets:
| 🎯 Target 1 | 43165 |
| 🎯 Target 2 | 42750 |
| 🎯 Target 3 | 42226 |
| 🎯 Target 4 | 41702 |
#TradingView #Nifty #BankNifty #DJI #NDQ #SENSEX #DAX #USOIL #GOLD #SILVER
#BHEL #HUDCO #LT #LTF #ABB #DIXON #SIEMENS #BALKRISIND #MRF #DIVISLAB
#MARUTI #HAL #SHREECEM #JSWSTEEL #MPHASIS #NATIONALUM #BALRAMCHIN #TRIVENI
#USDINR #EURUSD #USDJPY #NIFTY_MID_SELECT #CNXFINANCE
#SOLANA #ETHEREUM #BTCUSD #MATICUSDT #XRPUSDT
#Crypto #Bitcoin #BTC #CryptoTA #TradingView #PivotPoints #SupportResistance
uptrend After the amount of correction and fluctuation to the support levels, the trend change will take place in four forms and we will see a continuation of the upward trend.
US30 Technical Breakdown – 09/11/2025📍 US30 Technical Breakdown – 09/11/2025
US30 has finally broken out 🚀 after weeks of coiling below the 45,760 ceiling. Bulls smashed through resistance and printed new highs around 46,100, confirming strong upside momentum.
This breakout clears a major liquidity zone, putting buyers in full control. If price can hold above 45,760, we could see continuation into fresh territory.
📊 Current Market Behavior:
🚀 Clean breakout above 45,760 supply
📈 Momentum accelerating with strong bullish candles
🧱 Previous resistance now acting as new support (45,760 zone)
⚠️ Watch for retest before continuation
📌 Key Levels:
🔹 Resistance Zones:
46,100 → Fresh breakout high
46,250 → Expansion target
46,400 → Next resistance
🔹 Support Zones:
45,760 → Key breakout retest level
45,456 → Intraday demand
45,320 → Structural support
44,988 → Strong floor
🧠 Bias:
✅ Bullish above 45,760
Continuation higher likely if breakout holds
Pullback into 45,760–45,500 could offer re-entries
US30 ShortElite Analysis
All confirmations have been met
Executed off 15m TOB
Targeting lower liquidity pools

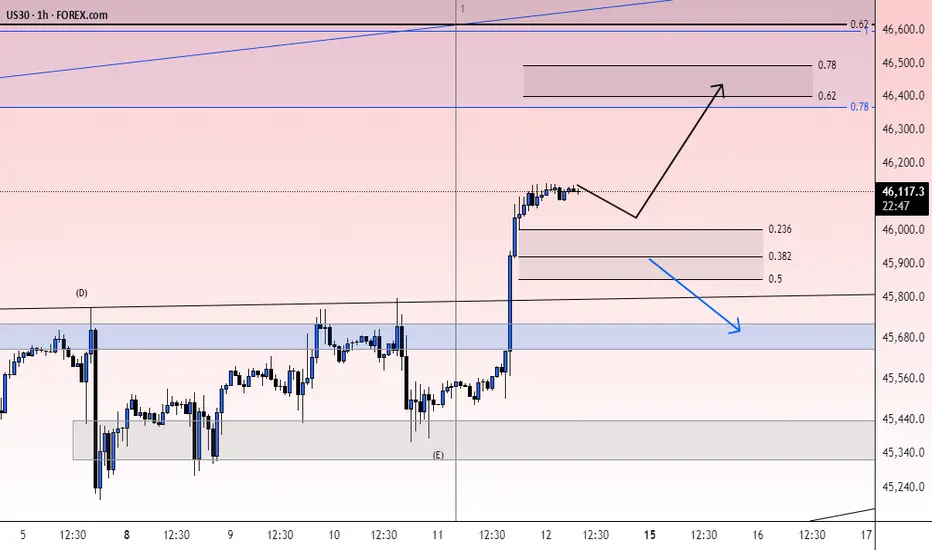
US30 Trade OutlookPrimary Bias: 🔻 Looking for short opportunities
I’ll be waiting for price to retest the 45,650 – 45,700 resistance zone. If the retest holds with bearish confirmation, I’ll look to enter sells targeting the 45,250 – 45,150 support area.
Alternative Scenario: 🔼 Possible buy setup
If price manages to break above the 45,750 resistance and retest it successfully, I’ll consider short-term buys towards 45,900.
👉 The main focus remains on sells at the resistance retest, unless the breakout and retest scenario invalidates it.

Us30 Trade Set Up Sep 10 2025FX:US30
www.tradingview.com
price has testes PDH and has made a BSL and SSL with a 15m FVG so i want to see either price test BSL, close under, form 1m-2m IFVG to target SSL or come to test 15m FVG, respect it, form 1m-2m IFVG and go higher

check the trend The upward trend is expected to advance to the resistance trend line. Then the possibility of a trend change and the start of a correction will be likely.
Dow for September 10thA very messy bar chart.Using the line/close to see thru the mess.needs to get a bid to get thru rez

US30 | Testing 45,800 Supply Zone – Bullish or Bearish?📌 US30 Daily Analysis – Key Decision Zone
US30 has been moving inside a rising wedge structure, making consistent higher highs and higher lows. Price is now testing a critical resistance zone around 45,700 – 45,800, which also aligns with the wedge top.
🔎 Key Observations:
Market is in a strong uptrend, but has reached a major supply area.
Liquidity rests above 45,800 (equal highs & breakout traders).
Demand zone sits around 45,200 – 45,000, which may act as support if rejection occurs.
✅ Possible Scenarios:
🟢 Bullish Continuation
A strong daily/4H close above 45,800 would confirm continuation.
Next upside targets: 46,200 → 46,600 → 47,000.
🔴 Bearish Rejection
If price rejects 45,800, watch for a Break of Structure (BoS) on 4H/1H.
Downside targets: 45,200 → 44,800 → 44,400.
🎯 Trading Plan
Wait for clear confirmation:
Break & Retest above 45,800 → look for longs.
Rejection + BoS on lower TF → look for shorts toward demand zones.

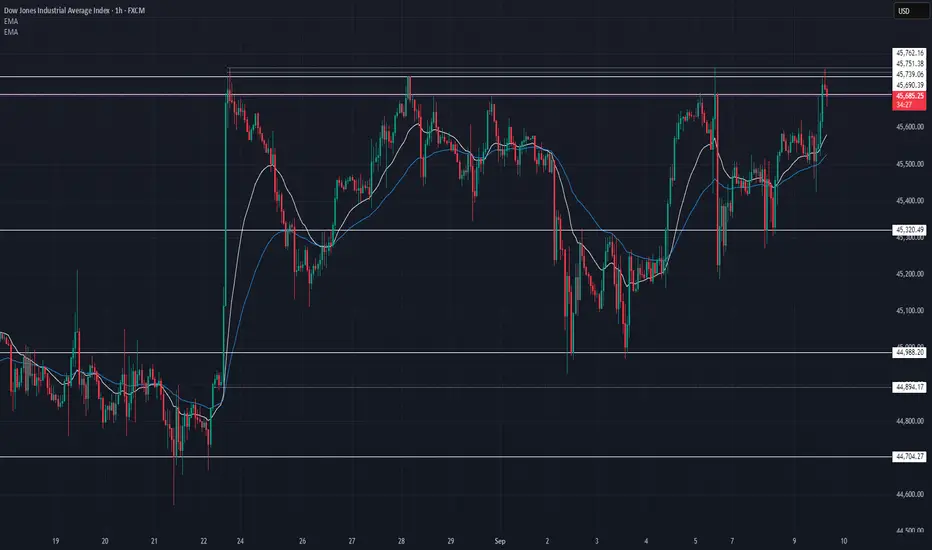
US30 Technical Breakdown – 09/09/2025📍 US30 Technical Breakdown – 09/09/2025
US30 just retested the major resistance cluster (45,690–45,762) and rejected again. Price continues to respect this ceiling, with buyers failing to hold momentum above it. Currently trading near 45,670, the index is consolidating under supply.
The EMAs are pointing up slightly, showing short-term bullish momentum, but the rejection confirms sellers are still defending the top of the range.
📊 Current Market Behavior:
🚀 Push into resistance → rejection wick
📉 Supply stacked at 45,690–45,760
🧱 Support forming at 45,500–45,320
⚠️ Market coiling → breakout setup
📌 Key Levels:
🔹 Resistance Zones:
45,690 → Immediate supply
45,739 → First rejection line
45,751–45,762 → Strong ceiling (triple top zone)
🔹 Support Zones:
45,500 → Short-term demand
45,320 → Structural support
44,988 → Deeper floor
44,704 → Strong demand zone
🧠 Bias:
⚖️ Neutral → leaning bearish below 45,690
Above 45,762 = bullish breakout
Below 45,320 = bearish correction
Dow Jones Analysis (US30 / Dow Jones):The index is currently trading around 45,550 after testing key support zones. The overall trend remains bullish in the short term, but price is moving in a sensitive range.
🔺 Bullish Scenario:
If the price holds above 45,560 – 45,600, the index may retest the previous high at 45,763. A breakout above this level could push the price toward 46,000.
🔻 Bearish Scenario:
If the price breaks below 45,500 and holds, the index may decline toward 45,270 as lower support levels.
📌 Key Buy Zones: 45,560 – 45,500
📍 Key Sell Zone: 45,480


#DJI - Pivot Point is 45258Date: 09-09-2025
#DJI - Current Price: 45515
Pivot Point: 45258
Upside Resistance Levels:
Resistance 1: 45796
Resistance 2: 46147
Resistance 3: 46498
Resistance 4: 46964
Resistance 5: 47429
Downside Support Levels:
Support 1: 44723
Support 2: 44371
Support 3: 44018
Support 4: 43553
Support 5: 43088
#TradingView #Nifty #BankNifty #DJI #NDQ #SENSEX #DAX #USOIL #GOLD #SILVER

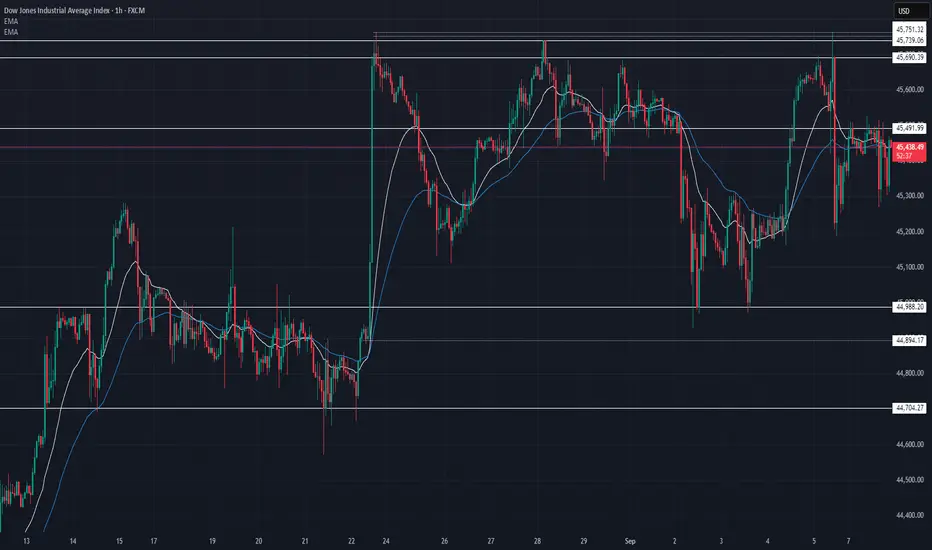
US30 Technical Breakdown – 09/08/2025📍 US30 Technical Breakdown – 09/08/2025
US30 continues to range tightly after failing to sustain the breakout above 45,750 resistance. Price is now chopping around 45,450, stuck between 45,490 resistance and 45,300–45,200 support.
The EMAs are flat and overlapping → confirming lack of trend direction. This is a compression zone before the next big move.
📊 Current Market Behavior:
🔄 Sideways chop between 45,200–45,700
📉 Multiple rejections at 45,750
🧱 Strong support holding around 45,200–45,300
⚠️ Volatility squeeze → expansion incoming
📌 Key Levels:
🔹 Resistance Zones:
45,490 → Intraday lid
45,690 → Minor supply
45,739–45,751 → Major rejection zone
🔹 Support Zones:
45,300–45,200 → Current demand pocket
44,988 → Mid-range floor
44,704 → Deeper support
🧠 Bias:
🔄 Neutral → Waiting for breakout
Above 45,750 = bullish continuation
Below 45,200 = bearish momentum shift

Us30 Trade Set Up Sep 8 2025FX:US30
www.tradingview.com
Price is currently at a 1h FVG and in between BSL/SSL so i want to see either liquidity level swept followed by a 1m/2m IFVG or RB formed and tested to continue higher.
I am overall bullish due to price making HH/HL but it is monday which usually has low volume so not expecting huge moves today
