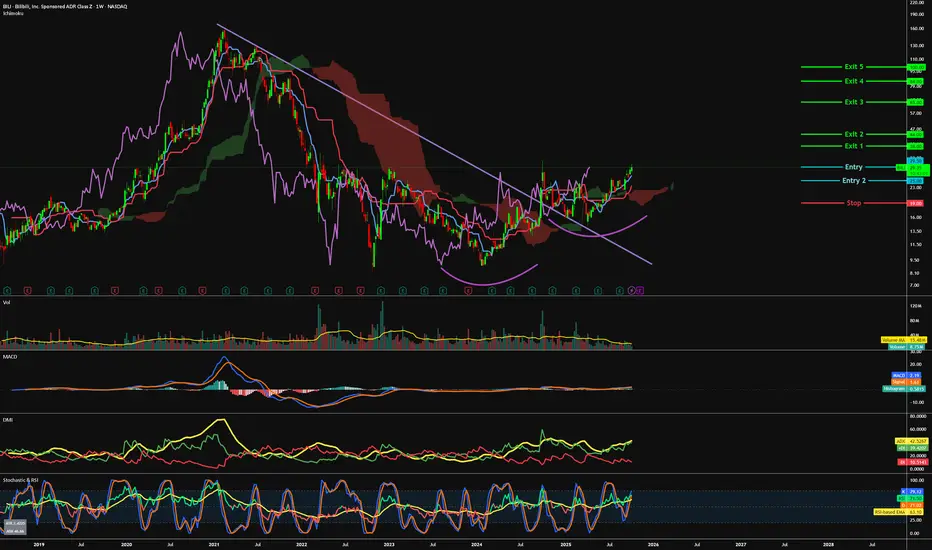
BILI Wyckoff AccumulationTICKER: NASDAQ:BILI
TIMEFRAME: 1D, 1W, 1M confluence
TREND: 1D, 1W, 1M bullish
RSI: neutral-bullish
FIBS: price inside 1D, 1W, 1M fib levels
POSITION: long
ENTRY: < $33
STOP: < $25
TP1: $40
TP2: $50
TP3: $60
RATIONALE:
BILI has officially broken out of a 3.5 year Wyckoff accumulation range, HTF
Bilibili Inc.
No trades
Next report date
—
Report period
—
EPS estimate
—
Revenue estimate
—
0.26 USD
−187.90 M USD
3.74 B USD
291.29 M
About Bilibili Inc.
Sector
Industry
CEO
Rui Chen
Website
Headquarters
Shanghai
Founded
2009
IPO date
Mar 28, 2018
Identifiers
3
ISIN KYG1098A1013
Bilibili, Inc. is a holding company, which engages in the provision of online entertainment content. The firm enables broad video-based content consumption scenarios centered around professional user generated videos supplemented with live broadcasting, occupationally generated videos, or occupationally generated videos. The company was founded by Xu Yi in June 2009 and is headquartered Shanghai, China.
Related stocks

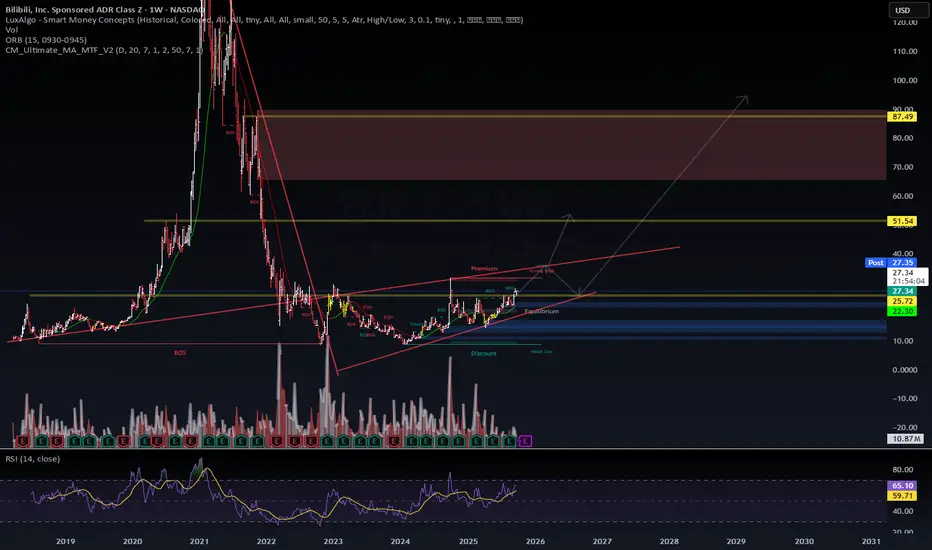
BILI mid-term TABilibili is building a strong and solid uptrend, there's a positive trend strength on daily and weekly time frames and it keeps accelerating. The channel within $30-35 was a good supply area and currently it is trying to fix above the channel upper resistance and continue the uptrend acceleration.

BILI: What are you seeing!BILI: What are you seeing?
.
Which patterns? ADAM- EVA pattern, or Cup n Handle, or anything else?
Don't care. They are just like as instance noodle.
Only just understand where you are standing, and why you are standing here, that's enough!
.
US STOCKS- WALL STREET DREAM- LET'S THE MARKET SPEAK!

BILI - On track to the top=======
Volume
=======
- decreasing
==========
Price Action
==========
- 3 years downtrend line broken and supported with pullback way above trend
- Cup and handle
=========
Oscillators
=========
- Ichimoku
>>> price above cloud
>>> budding green kumo noticed
>>> base + conv + lagging above cloud
BILI (Bilibili Inc.) – Measured Move Trade Setup📈 BILI (Bilibili Inc.) – Measured Move Trade Setup
Idea:
Price action shows a clean measured move in play. After rallying from $22.21 → $28.20, BILI consolidated back toward the $25.72–26.00 support zone. This level aligns with Fib 0.5 and channel mid-support, now acting as the base for the next le

BILI: Multiple TF AnalysisDaily Chart (1D)
Current Price: ~$27.35 (+4.07%)
Support Zone: $25.72 (prior consolidation, breakout retest level)
Trend Structure: Price is following a rising wedge/ascending channel since early 2023.
Near-term Target: $32–$35 (upper wedge resistance).
Breakout Path: If price closes above $36
BILI | China Tech Will Rise | LONGBilibili, Inc. is a holding company, which engages in the provision of online entertainment content. The firm enables broad video-based content consumption scenarios centered around professional user generated videos supplemented with live broadcasting, occupationally generated videos, or occupation

Bilibili Inc. (BILI) — Gaming Growth & Shareholder ValueBilibili Inc. NASDAQ:BILI , a leading Chinese online entertainment platform, continues to capture younger audiences through video, live streaming, and gaming while actively expanding into Southeast Asia for international growth.
Key Catalysts:
Gaming momentum: Mobile gaming revenue jumped +60% Yo

BILI Earnings Trade Setup (High Conviction Call Play)
🚀 **BILI Earnings Trade Setup (High Conviction Call Play)** 🚀
📊 **Earnings Date:** Aug 25, 2025 (BMO)
🎯 **Expected Move:** +5–7%
💡 **Conviction:** 75% Bullish
---
🔥 **TRADE DETAILS** 🔥
* 📌 **Ticker:** \ NASDAQ:BILI
* 📈 **Direction:** CALL (LONG)
* 🎯 **Strike:** \$26.00
* 💵 **Entry Price:** \$0

BILI: Long up view chartBILI: Long up view chart
-Adam and Eva swinging consolidation pattern.
-Key level and demand zone support at the entry.
-Less supply zone at the backtest.
See and wait!
US STOCKS- WALL STREET DREAM- LET'S THE MARKET SPEAK!

See all ideas
Summarizing what the indicators are suggesting.
Neutral
SellBuy
Strong sellStrong buy
Strong sellSellNeutralBuyStrong buy
Neutral
SellBuy
Strong sellStrong buy
Strong sellSellNeutralBuyStrong buy
Neutral
SellBuy
Strong sellStrong buy
Strong sellSellNeutralBuyStrong buy
An aggregate view of professional's ratings.
Neutral
SellBuy
Strong sellStrong buy
Strong sellSellNeutralBuyStrong buy
Neutral
SellBuy
Strong sellStrong buy
Strong sellSellNeutralBuyStrong buy
Neutral
SellBuy
Strong sellStrong buy
Strong sellSellNeutralBuyStrong buy
Displays a symbol's price movements over previous years to identify recurring trends.
BILI5509419
Bilibili Inc. 0.5% 01-DEC-2026Yield to maturity
—
Maturity date
Dec 1, 2026
BILI4994672
Bilibili Inc. 1.375% 01-APR-2026Yield to maturity
—
Maturity date
Apr 1, 2026
BILI5196943
Bilibili Inc. 1.25% 15-JUN-2027Yield to maturity
—
Maturity date
Jun 15, 2027
See all BLBLF bonds
159792
Wells Fargo China Securities Hong Kong Stock Connect Internet ETFWeight
2.92%
Market value
198.47 M
USD
Explore more ETFs
Frequently Asked Questions
The current price of BLBLF is 25.58 USD — it has decreased by −4.37% in the past 24 hours. Watch Bilibili Inc. stock price performance more closely on the chart.
Depending on the exchange, the stock ticker may vary. For instance, on OTC exchange Bilibili Inc. stocks are traded under the ticker BLBLF.
We've gathered analysts' opinions on Bilibili Inc. future price: according to them, BLBLF price has a max estimate of 40.38 USD and a min estimate of 19.31 USD. Watch BLBLF chart and read a more detailed Bilibili Inc. stock forecast: see what analysts think of Bilibili Inc. and suggest that you do with its stocks.
BLBLF reached its all-time high on Jan 14, 2026 with the price of 34.00 USD, and its all-time low was 10.70 USD and was reached on Dec 22, 2023. View more price dynamics on BLBLF chart.
See other stocks reaching their highest and lowest prices.
See other stocks reaching their highest and lowest prices.
BLBLF stock is 4.57% volatile and has beta coefficient of 2.03. Track Bilibili Inc. stock price on the chart and check out the list of the most volatile stocks — is Bilibili Inc. there?
Today Bilibili Inc. has the market capitalization of 13.08 B, it has decreased by −4.41% over the last week.
Yes, you can track Bilibili Inc. financials in yearly and quarterly reports right on TradingView.
Bilibili Inc. is going to release the next earnings report on Mar 5, 2026. Keep track of upcoming events with our Earnings Calendar.
BLBLF earnings for the last quarter are 0.25 USD per share, whereas the estimation was 0.21 USD resulting in a 19.60% surprise. The estimated earnings for the next quarter are 0.25 USD per share. See more details about Bilibili Inc. earnings.
Bilibili Inc. revenue for the last quarter amounts to 1.08 B USD, despite the estimated figure of 1.07 B USD. In the next quarter, revenue is expected to reach 1.15 B USD.
BLBLF net income for the last quarter is 66.00 M USD, while the quarter before that showed 30.09 M USD of net income which accounts for 119.32% change. Track more Bilibili Inc. financial stats to get the full picture.
No, BLBLF doesn't pay any dividends to its shareholders. But don't worry, we've prepared a list of high-dividend stocks for you.
As of Feb 14, 2026, the company has 8.09 K employees. See our rating of the largest employees — is Bilibili Inc. on this list?
EBITDA measures a company's operating performance, its growth signifies an improvement in the efficiency of a company. Bilibili Inc. EBITDA is 449.47 M USD, and current EBITDA margin is 4.31%. See more stats in Bilibili Inc. financial statements.
Like other stocks, BLBLF shares are traded on stock exchanges, e.g. Nasdaq, Nyse, Euronext, and the easiest way to buy them is through an online stock broker. To do this, you need to open an account and follow a broker's procedures, then start trading. You can trade Bilibili Inc. stock right from TradingView charts — choose your broker and connect to your account.
Investing in stocks requires a comprehensive research: you should carefully study all the available data, e.g. company's financials, related news, and its technical analysis. So Bilibili Inc. technincal analysis shows the buy rating today, and its 1 week rating is buy. Since market conditions are prone to changes, it's worth looking a bit further into the future — according to the 1 month rating Bilibili Inc. stock shows the buy signal. See more of Bilibili Inc. technicals for a more comprehensive analysis.
If you're still not sure, try looking for inspiration in our curated watchlists.
If you're still not sure, try looking for inspiration in our curated watchlists.