The secrete trend line no one will show you and the buy signalsJust a quick look here.
Another trend line that the BTC price broke through with that big candle in March. BTC first broke through MA Pi bottom resistance kin January then held it as support. Look at when it happened... Literally right after it crossed!!! It is now playing with the top of WHITE trend line. I believe it will continue to do so for a period of time. This is a similar trend line BTC formed in 2015 of of it's lows back then.
Pi Cycle bottom being held as support. BUY
The MZ BTC Oscillator is dark green making confluence for the BUY.
Steve's NVT HV. This one is 100% accurate. When the RED AND WHITE LINE (volatility) goes below the YELLOW line and comes back up and is RED a move is to follow in the upward direction. If it's WHITE then it will correct. The color before entering is insignificant to the confirmation signal. NVT coming up RED Confirms the BUY!
There is a move brewing and it smells like a pump.
Kind Regards
WeAreSat0shi
Trade ideas

Elliot wave nearing 4/5Obviously the debt ceiling was going to be expanded since the Americans will not give up their "credibility" and the world reserve currency Expect weekly to close around $27.250
Wednesday
- French, Italian, and German inflation YOY
- Japanese Consumer confidence
Thursday
- Inflation and unemployment rate eurozone YOY
- US ISM manufacturing PMI
Friday
- US Unemploymentrate and non-farm payrolls
Looks reasonable to retest the former range when taking the Elliot Wave into account, $25.200 range top June 2022 – March 2023 has a lot of liquidity. However I am bullish from here
Target for June would be approximately around $35

Possibility of catastrophic declineIf you check the 6-month candlestick chart, all candlesticks have formed lower tails. However, lower tails are not confirmed for the bar currently in progress. It is possible to go see the bottom tail before the next candlestick is made.

Fib levels confirm next Bitcoin cycle top in mid-2025Focusing on the Fib wedge here, it can be seen that each Fibonacci level has marked Bitcoin's top so far.
1. The zero point of the fib wedge is exactly where BLX price starts from at around $0.05 in 2010
2. The first fib level 0.236 marked the top around $30 in 2011
3. The second fib level 0.382 marked the top around $1100 in 2014
4. The third fib level 0.618 marked the top around $20,000 in 2017
5. The fourth fib level 0.786 marked the top around $66,000 in 2021
These are FIVE points of reference with pin-point accuracy. Not "by chance" or "coincidence".
Therefore, it is only fair to assume that the 6th one, which also completes this fib wedge being the final level of 1.0 on the fib wedge, is going to mark the next cycle top as well.
A highly conservative top would be around $150,000 while a more realistic target seems to be around $200,000 to $250,000 . On the other hand, a highly optimistic target is around $300,000.
Also inferring from the chart an approximate time-point can be seen of mid-2025 for the next BTCUSD cycle top. A mid-cucle top of $120,000 to $150,000 in mid 2024 is also possible.
The important thing to remember is fib level 1.0 around mid-2025. How the price gets there is anyone's guess.
===
Sidenote: The series of 5 side-by-side fib retracements each are set as follows:
- 0 marks the top of each cycle
- 1 is aligned with the bottom of the cycle immediately preceding it
The resulting congruence among the retracements and their harmony with each other is astounding.
===
Disclaimer: Keep in mind that market predictions are about as reliable as a weather forecast in outer space. Use this analysis as a conversation starter, not as financial advice. Investing in cryptocurrencies carries risks, so do your homework and make informed decisions. Remember, no crystal balls here—just a pinch of insight and a dash of caution

The history of the Flash Crashes in BTC, how to make money on itI'll start this post with what I've earned on the covid flash crash myself. This success was repeated in May 2021 but in other token.
That's why I know a little about it.
At the end I wrote why next flash crash is possible
Bitcoin and other cryptocurrencies often experience flash crashes when there are sharp and significant price declines for a short period of time. These events can be triggered by a variety of factors, including market panics, big selling, news, or regulatory changes. Here are a few known instances of flash crashes in bitcoin history :
The flash crash On June 19, 2011, the price of bitcoin dropped from about $17.50 to just $0.01 on the low-volume Mt.Gox exchange. The reason for this flash crash was a huge sales order to sell 2,000 bitcoins at the market price.
Flash Crash On April 10, 2013, the price of bitcoin plummeted from about $260 to $45 in a short period of time. This followed a series of crashes on the Mt.Gox exchange and a number of other factors that caused panic among traders.
Flash crash On June 21, 2017, the price of bitcoin on some exchanges dropped from about $2,800 to $0.10 in just a few seconds. This was caused by a technical malfunction on the GDAX exchange that led to the execution of a bitcoin sell order at a low price.
Flash Crash On September 17, 2019, the price of bitcoin on the Bitstamp exchange plummeted from about $10,000 to $8,100 in a short period of time. The reason for this flash crash was a large sale order for 5,000 bitcoins on the exchange.
Flash crash in 2020: On March 12, 2020, the price of bitcoin dropped by about 50% in a few hours, falling from about $8,000 to $4,000. This flush crash was caused by market panic related to the global COVID-19 pandemic and its impact on financial markets.
Flash crash in 2020: On May 10, 2020, the price of bitcoin dropped more than 10% in just a few minutes. This happened after bitcoin sales orders worth about $30 million were executed on the BitMEX exchange.
Causes of Flash Crashes
-Flash crashes, or sharp and brief drops in asset prices in financial markets, can be caused by a variety of reasons. Some of the main causes of flash crashes include:
-Automated trading systems: The use of computer programs and algorithms to perform a large number of trades can lead to a situation where these systems start selling assets automatically in response to certain market conditions. This may lead to a spike in sales and a sharp drop in prices, resulting in a flash crash.
- Market Liquidity: Lack of liquidity in the market, that is, the inability to quickly buy or sell assets without a significant change in their price, can contribute to the occurrence of flash crashes. When large numbers of investors are trying to sell assets at the same time and there are not enough buyers, prices may decline sharply.
- Systemic Failures: Technical failures and errors in trading platforms or settlement systems may cause flash cracks. Incorrect orders or execution of trades, delays in transmitting information, or problems with transaction processing may create volatility in the market and provoke sharp drops in prices.
- Market Emotions and Panic: Heightened nervousness, emotional reactions, and panic among investors can also contribute to flash crashes. If a significant number of investors start selling assets en masse due to fear and anxiety, it can cause a spike in sales and a sharp drop in prices.
What were some inefficiencies in the market that could be exploited in the financial markets
There are several instances in the financial markets where inefficiencies could be detected and exploited for profit. Some of these cases include:
-Arbitrage between different markets: If assets are traded on different markets or exchanges at different prices, one could buy an asset at a lower price in one market and sell it at a higher price in another market, profiting from the difference in prices. This is known as arbitrage.
-Mispricing Companies: Sometimes investors may mispriced companies' stocks, creating opportunities to buy undervalued stocks or sell overvalued stocks. Such valuation mismatches can create opportunities for profits.
-Temporary Price Mismatches: Sometimes there are temporary asset price mismatches in financial markets caused by panic, emotion or unforeseen events. If an investor is able to identify such mismatches and take appropriate action, he or she may profit from their correction.
Explore the last point
Temporary price mismatches in financial markets occur when asset prices deviate from their fundamental value for a short period of time. This can be caused by various factors such as panic, traders' emotional reactions, unexpected news or errors in trading algorithms.
Temporary price mismatches present opportunities for traders or investors to capitalize on the difference between the current price and the fundamental value of an asset. Some examples of timing mismatches in prices include:
Inefficiency of crypto exchanges: There can be differences in asset prices on different trading platforms, especially during volatile market conditions. Traders can exploit these differences to buy an asset at a lower price on one platform and sell it at a higher price on another platform, making arbitrage profits.
Use of Algorithmic Trading: Algorithmic trading systems can cause timing mismatches in prices. For example, if an algorithmic system triggers a large number of sell orders in a short period of time, it may cause the price of an asset to go down. Traders may try to take advantage of such situations to profit by entering buy positions when prices decrease due to algorithmic selling.
This is due to the fact that players who want to make money on Funding/Countdown and their ideal market is a flat and when the market moves, they simply leave the market and wait for a less volatile market. This is why there is a liquidity crisis on some exchanges and there is a price overshoot.
All signs of a flash crash, signaling as much as I can:
1.The exchanges also believed in the latest surge in trading volumes and are now going full steam ahead.
2.The crowd is sitting in coinlist and seals with potential profits.
3.The crowd is playing or holding memcoins.
4.Crowd sits in altcoins, which is "still cheap" and already near December lowes
5.No new steibles are released - no one from the outside is interested in crypto, those who wanted have already bought it
6. Bankfallls
7.FEDnow release
8.The subcycle in the global cycle I mentioned in other posts
That's why I recommend to register at different exchanges, to study and test different trading terminals
Best regards EXCAVO

Bitcoin: Not a buyer until it breaks this line upwardsBitcoin: Not a buyer until it breaks this line upwards

AW Bitcoin Analysis - Head And Shoulders Above The Rest...In this video, we build upon the previous Bitcoin post, diving deeper into the count and potential correction unfolding. I share my thoughts on the possibilities of how the current wave could form, starting with an understanding of corrective pattern formation. Using the previous waves as a guide, we explore the general observed patterns, leveraging the concepts allowed by AriasWave.
When dealing with variables, there is no preferred count. Instead, we focus on the factors afforded by the thought process driven by the methodology. In support of this idea, we discuss the $168 retracement, which aligns with a similar length measure down from the neckline. This analysis suggests that the price won't reach zero, as that outcome appears less likely. However, if the price approaches this level, it will indicate extreme market psychology driven by the prevailing narrative at that time.
As always, it's important to remember that these predictions are not exact, but rather a form of envisioning made possible by understanding the concepts embedded within AriasWave. By exploring different scenarios and factors, we gain insights into potential outcomes and the psychological dynamics at play in the markets.
Join me in this video as we delve into the intricacies of the current wave formation, examining the patterns and narrative shaping Bitcoin's journey. Through the lens of AriasWave, we gain a deeper understanding of the market dynamics and the possibilities that lie ahead.
Disclaimer: All predictions are subject to change as new information emerges, and individual analysis should be conducted alongside this discussion.

AW Bitcoin Analysis - Your Account Will Hold You Accountable...Join us on this video journey as we explore the significance of AriasWave in delivering the best wave analysis. By understanding the count for Bitcoin, we uncover the intriguing nature of corrections, which can be either lengthy or deep, showcasing the concept of alternation emphasized by Elliott. However, AriasWave takes wave analysis to new heights.
Critics who hold a negative opinion of AriasWave analysis must recognize that they are potentially opposing the successful side of the trade. Our methodology is the result of eight years of meticulous backtesting, thoughtful analysis, and a comprehensive collection of all counts presented on this channel. The multitude of variations seen over the past two years is a testament to the preparation for AriasWave's entrance into the mainstream.
Today, we stand at the pinnacle of our journey, armed with deep counts that shape the future of AriasWave methodology. The same clarity and depth I bring when speaking is mirrored in my analytical posts, contributing to the growth and success of AriasWave.
Moving forward, our analysis will be based on the preferred counts before March 2023, marking the completion of extensive testing. This grants us a range of options to proceed, while ensuring that we consistently provide you with the real count based on AriasWave and our final determinations. Any count adjustments will be minimal, mostly occurring at small degrees.
Join us as we navigate the fascinating world of wave analysis, driven by AriasWave's proven methodology and unwavering commitment to delivering accurate and insightful analyses.

BTC fake Bitcoin momentum study - Going down to $1200 wave A. BTC fake Bitcoin momentum study - Going down to $1200 wave A.

BTC fake Bitcoin momentum chart updatedThis momentum study shows us that BTC Bitcoin may only have 160 to 195% gains left to give the market. 70 to 80k

BTC Possible highs lows - my independent thesis This is my BTC thesis using simple metrics - not taking into consideration the BTC halving event
I have taken each BTC bull and bear cycles from start to finish to find an average bull and bear cycle beginning and end
Also using a simple metric to guesstimate a 2 possible market highs for BTC this time around.
I cannot add variables such as black swan events - or possible unforeseen / planned attacks to the BTC network
These are my own thoughts only and should not be perceived as financial advice.
please feel fee to critique

Not a Financial advice BUT MAYBE a Financial repetitionCould be disputed, Could be wrong, depending on which theory you believe in.
it has never been, and doesn't have to always be, but it was.
So what will it be ? it could be what will be !

Bitcoin's Negative Correlation with US Dollar Index It is already pretty obvious to any analyst - a stronger dollar means a weaker crypto or stock market, and a weaker dollar trends toward stronger crypto and stock markets.
As you can see on the chart, Bitcoin (BLX) has a crystal clear negative correlation with the US Dollar Index (DXY), as expected. So, why am I talking about it?
Each time DXY has peaked, BLX has made a new low, and vice versa. A large majority of these major milestones first occur on DXY, prior to following in the opposite direction with Bitcoin. There is one exception noted above during the March 2020 black swan event, where DXY peaked after Bitcoin and stock markets bottomed. Otherwise, most of these events happen first on DXY, and then markets follow.
Presently, DXY has closed its weekly candle above the neckline of a confirmed head & shoulders pattern. Is this just a pullback, or are we headed towards ~105-106 and a failed HS?
If you zoom out on DXY's monthly chart, it looks more like a bullish re-test of a breakout, but still possible it moves back down into the 90s:
Conclusion:
Can we use this assumption again now: that DXY can an early indicator in determining direction of Bitcoin and the crypto/stock markets as a whole?

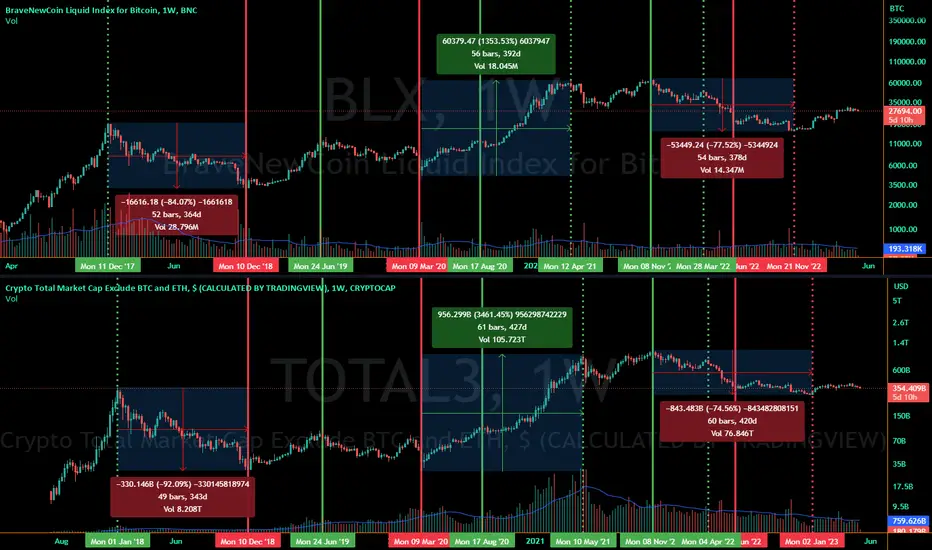
Growth/Losses of All Altcoins Excluding Eth vs. BitcoinHere's a look at major peaks and valleys in Bitcoin and Total3 (total altcoin market excluding Ethereum) starting from the Dec 2017 peak until now. First, a key to follow along:
Key:
- Solid Green/Red Lines = Peaks/Valleys occurring during the same week or day between both markets
- Dotted Green/Red Lines = Peaks/Valleys where dates deviate between the two markets
Traditionally peaks and valleys have happened around the same time, sometimes with minor deviation where altcoin market's peak or valley occurs shortly after Bitcoin's, if not on the same week or day, and altcoins as a whole have typically shown stronger losses than Bitcoin from peak to valley, in the past.
After the 2017/18 peaks, Total3 lost more, in less time, than Bitcoin. It peaked a few weeks later and then bottomed on the same week.
More recently, that deviation has grown in length and changed in scope. Here's how:
March 2020 low through the April/May peak:
--Total3 moved stronger and for longer (by just under a month) than Bitcoin. It typically does move stronger, but moves tend to end nearer to each other than what happened here.
November 2021 ATH to our most recent ATL:
-- Despite many alts having steeper losses than Bitcoin, as a whole Total3 lost approximately 3% less than Bitcoin and its valley occurred 6 weeks after Bitcoin's. In this case, it moved weaker than Bitcoin and has shown the longest deviation in the time it took to do so.
About a month ago, around April 13th, Bitcoin made a new local high. Altcoins haven't yet followed. Interesting, right?
That said, we still don't know for sure whether Bitcoin is headed towards a new peak or a new valley. Let's see how this plays out.
$BTC - BULL Cycle CONFIRMED - $500,000+ by 2026Bitcoin BULL CYCLE 🐂Confirmed
1 BTC = 500,000+ by 2026
World Economic changes are in favor of #Bitcoin
Regulations, ETFs, Payments etc.
#BTC will become $10T Marketcap
#Ethereum will be $5T

BLX/USD Bitcoin on the weekly candleI think we will continue in the sideways wave until November 25th, and the bottom will be at 21750 for this wave. Then, the rise will begin to break the previous top, which is 69,000

BTCUSDT WEEKLY Analysis May 12, 2023There will always be volatility with BNC:BLX Bitcoin and the CRYPTOCAP:TOTAL Crypto space. We are still accumulating at these levels. Hopefully this chart will ease your worry and stress. We are in good shape.
Still Bullish on the Weekly! #FollowTheSignals
Not Financial Advice...Trade with Confidence and Control.

Bitcoin rainbowwww.tradingview.com Back in the purple again. Hopefully this means the end of the current mini bear market. Maybe this is a trend of less volatility with subsequent 4 year cycles. A 60% drop instead of 80% like in 2018.

Maybe the bull market isn't over?The timing is not consistent with past cycles for the current bull cycle to be over. There may be more to come, but who is to say? Regardless, there must be a significant uptrend shortly (within the next 3 months) if the bull is not dead.

Bitcoin price spends majority of time in the "fire sale" band.Just eyeballing it, looks like the BTC price spends most of the time in the lowest band of the rainbow. The rest of the time it is transitioning by either escaping from it and going to the moon, or coming back to earth.

BTCUSD to $333,333 by mid-2025Fib retracements for each major phase since the beginning. Each phase has corresponding fib retracement levels to previous phase.
For example 0.786 of each phase aligns with 0.236 of the preceding phase.
If this plays out again, it would suggest the next major top at around $333,333.33 (approximately) for BITSTAMP:BTCUSD
Furthermore, Fib Time Zone extensions suggests possible time frame for next major price point to be around mid 2025.
Note: All Fib levels have been drawn for personal musings and entertainment, definitely not to be taken as financial advice.

Bitcoin Price projection similar to 2016-17 bull runOf course, this is only a projection and it is possible this may not play out. Chart is based on PI cycle tops and bottoms. Good luck and always use stops.

Lengthening Elliot waves cyclesThis theory suggests that elliot wave cycles are lengthening, this can co-exsist with the 4 year cycle of the bitcoin halving.
The key difference is that we should get an extension in the 5th wave(blow-off top) this 4 year cycle.
Looking at past cycles, the 5th wave was also the strongest move so yes we could have an greater rally than in 2020/2021.
If we get an equal rally in %-wise like in 2020/2021 we get an measurement of 1600% from 15k to 250k
And if the 5th wave goes beyond the 3th wave you get some crazy targets in an short period of time (blow-off top)
If this theory is correct this could back up some crazy btc targets because this is the first cycle when we already made an new all time high in the 3th wave compare to other cycles only in the 5th wave.
Yes it took longer to get there but thats the theory that each cycle will take more time to fininsh
In the charts below when you measure the bottom from an complete elliot wave to the next you get some data that suggests lenghtening elliot wave cycles
Cycle 1:
Cycle 2:
Cycle 3:
Cycle 4:
