BTC Long TermBuy Everything Below 20 000$
Ultra Buy At 14 000$
First Target - 57 000$ - 58 000$
Second Target - 97 000$ - 108 000$
Third Target - 180 000$ - 200 000$
The Moon Target - 450 000$ - 500 000$
Blow OF TOP ))
BLX trade ideas

BLX - Indicator AnalysisUsing two indicators
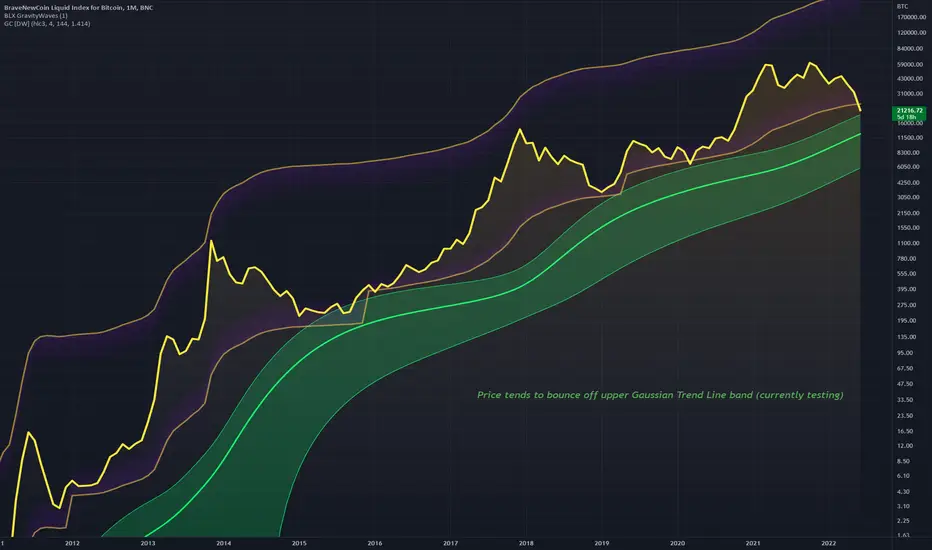
BLX GravityWaves
Gaussian Channel
It can be seen that price tends to bounce off the upper band of the Gaussian band, and simultaneously the lower band of the Gravity waves
Right now price is testing that area on this Monthly timeframe for BLX
Based off this info a good entry here can be surmised
June 24 2022: HOMEWORK WITH OJIdentifying BREAK OF STRUCTURE LH HL HH HL . This is not giving any direction of where the market is going, I am just looking at market structure. I am not a financial advisor

Parabolic SymmetryBLX 3M. ^10 charts only over here.
A bottom here near $6.8K fits beautifully.
Bullish fibonacci levels.
We could very well be living through the most important time in bitcoin history.
1:1 is pretty high up there. Whoa.
Could be.
.. Just an idea.r

Bitcoins bubble about to burst?Its possible bitcoin has finished 5 waves up on the macroscale. If it has we have entered a long and devastating bearmarket that Will last years. Watch out for break out of the wedge to the downside. If we dip below 20 k it could get ugly. We will have to see how the waves develop.
Im not sure if the red wave 4 in the blue wave 5 is still ongoing( I doubt it). If it is we Can expect one more high.
For now we watch if the move Down from top unfolds in 5 waves and how deep it goes.

Bitcoin Logarithmic Growth Curve @Melvin'sMoves Its the same curve but on monthly candles. Lmk if anyone has thoughts on it


It easily broke the previous cycle's highest price.It easily broke the previous cycle's highest price in Bitcoin history. What this means is that even if Bitcoin reaches the early $10,000 level, it will rebound again and decline.

Trend-based Fib extensions showing us the topI marked the blue 1.618 extensions that indicated the top before. When the 0.786 marks the local top, the 1.618 seems to indicate the next cycle's top. This cycle the 0.786 is at practically the same price as the 1.618 extension of the previous cycle !!

BTC/USDT - 86400BUY BTC/USD with a target of 86400$.
BTC Extremely oversold at support zone. Buy triggered with a high volume, and It is a clear sign of trend reversal to ATH (86k$).first resistance 36k$ then correction to 24500$ and 2nd resistance 49600$ then correction and ATH
86K$.

Bitcoin Logarithmic Growth Curve with Fractal @Melvin'sMoves This is the same chart but with a potential fractal on how btc can play out! The fractal is from May 20, 2013 -Aug 26, 2013 BITSTAMP:BTCUSD BNC:BLX
Fractal is from the red circle

Bitcoin Logarithmic Growth Curve @Melvin'sMoves I made these curves and I havent seen any curves as accurate as mine. So if anyone has any thoughts n it let me know ! BITSTAMP:BTCUSD BNC:BLX

$BTC Bitcoin Weekly Levels - Wave 4I like how we are at an 88.6% retracement on GBTC, while BOTH are backtesting old resistance as support (so far)
Bitcoin is here once again testing the 200 week moving average, and just below it now, which is not abnormal in past instances.
These variables have been consistance long term buy signals over and over again throughout history.
I am not calling this " The Bottom " just yet but its a good place to start. We cannot break below 13,800 without invalidating this entire Bull cycle, and it would really make me start thinking about distribution far lower than anyone would expect. This is an important level, as Wave 4 cannot enter Wave 1 territory.
Can we wick lower? Sure, but at this point in the cycle you should start focusing on the Halvening cycle and accumulating. Limit orders are a useful tool in volatile times like these, especially when it comes to alt coins as Bitcoin makes violent moves.
Short term, ive posted another hourly chart showing the possiblilty of a Bullish Cypher developing which, if valid, will ultimately give us a Bearish Butterfly, 1.272 upward to about 24500 or so.

Bitcoin - Next Bounce ZoneBy drawing a Fib Retracement from 0 - all time high of 69k, we have the next big bounce zone of 16.3k
Notice how price has reacted to each and every fib as we go lower (see white circles) - every time it has hit each fib it's been a big bounce and a wick. Placing a BUY order here is likely to be a very, very low risk to high reward.
Also notice November 2020 - do you see that red weekly candle I've circled in Red? That's the same Fib as we are looking at right here, within around $30 difference.
Setting some BUY orders for around 16.3k.
Please note: This is the "BLX" chart - it enables you to see price history from the origin of Bitcoin and is a global price index. I suggest you draw the same fib on your Exchange's chart, starting from 0 to get the exact number. However, around this zone, maybe bidding a couple of hundred $ higher should be fine!
I also reversed this Fib because I wanted to find out potential targets for the long term future. This would be TP1 97.5k and TP2 111k once the bear market finishes.
----------------------------
I see so many people obsessing over MA's, trying to guess which MA will be the bottom - "300 Week, 400 Week.."? ....... using only price history from 2 previous bear markets, rather than using data FROM THE CURRENT CYCLE.
These fibs are PROVEN to be respected!
---------------------------

Bitcoin 1W : Long or What?Follow us for more analysis & Feel free to ask any questions you have, we are here to help.
⚠️ This Analysis will be updated ...
📅 06.22.2022
⚠️(DYOR)
❤️ If you apperciate my work , Please like and comment , It Keeps me motivated to do better ❤️

BTC Current Situation 6/22/22From a very long perspective the best times to buy massive amounts of BTC for the long haul has been at the 4 year (1460 Day MA). When price falls below this area it has so far been a tremendous discount for the long term. I do want to caution however that when this happens, there can be wild swings and an increase in volatility in the near term. We could easily wick down to 14k in a quick panic and not think twice about it.
From a trend trading perspective we are still fairly far from what I would consider bullish. And I'm talking near 36k with staying power.
I'm not saying that BTC won't only go up from here, I'm just saying that from a risk management perspective there's no way to honestly tell where we're headed near term.

Mega Bitcoin 600 R long tradeI will enter this mega Bitcoin 600 R long trade to $1.000.000 until 2025

has the bottom already been reached?In both 2015 and 2018, the price of BTC bottomed out exactly in the week where the 20 MA crossed the 100 MA on the weekly chart. In both cases, the 50 MA also crossed the 100 MA and this was a confirmation of the bottom imo. In both cases, RSI was below 30 and at their all-time lows.
In the week of June 13, 2022, the 20 MA crossed the 100 MA. The 50 MA is also about to cross the 100 MA in a few weeks. Even now, the RSI is below 30. In fact, it is now at its all-time low.
In the past these were the best times to buy, would history repeat itself?
Also on the 4D chart, both on 13 june 2015 and 25 january 2019, the 50 MA death crossed the 200 MA. Back then, this was also a sign of the end of the bear market for BTC. In about 3 to 4 weeks, we will see the same death cross on the 4D chart.
BTC has never wicked below the 300 MA. Will this bear market be the same, or will the price go under the 30 MA.
It will be interesting to see what happens in the next few weeks and months.

🔵 Behavior may be repeated #btc #bitcoin
🔵 Behavior may be repeated #btc #bitcoin #cryptocurrency #CryptoMarket #Cryptocrash


Buy the dipLogarithmic growth curve at the lowest band.
Bitcoin is going up from here to 150k
What else to say?

50% Crashes below the 2 year Moving Average for #BTC Have been end of bear cycles events --- ignoring the CV19 crash which was a correlation 1 event.
It could be an extremely profitable 6 months putting new capital to work in the #Crypto space.
Creating a shopping list of coins that will outperform should be your main priority these coming months.
#ETH
#HEX
#LTC
#THETA
#BNB

Long term BTC cycleWhile everyone now are focused on where Bitcoin is heading in short term - look here for a possible option.
Based on previous tops in 2021..
