Be careful today!! Bitcoin is at a possible turning point. Candle copied this fractal, which the current fractal looks nearly identical. Watch out for after July 17 if price action goes down. It all lines up with SPY, time to make a move. Be careful. Use stoploss
BLX trade ideas

BTC Long Term UpdateComing back to this idea I posted before on a 3M Time Frame
Checking the 6M now, Massive hidden bullish div on the chart
6M RSI is at the 2018 bottom as well.
17.5 Could have been the bottom

looks like the market has hit target for the bottom btc has been going down and sideways for about 400 days since it first hit 64000. and has hit the 3.82 retrace. this lines up with previous cycles tops and bottoms. 400 days and a dump near the 3.82 from bull market top. then some sideways action, as price slowly rises for bout 600 days towards previous cycle high. then cycle tops near 800-1000 days. i think now is a great time to dollar cost average, into your favorite coins. and throw some money on some low cap coins over the next 600 days and watch your wealth grow like never before. dont miss this run. even just a few thousand can create life changing opportunity. remember most alts have to go up 1000% to recover to previous highs. not to mention break into price discovery on the next run to gain larger percentage.

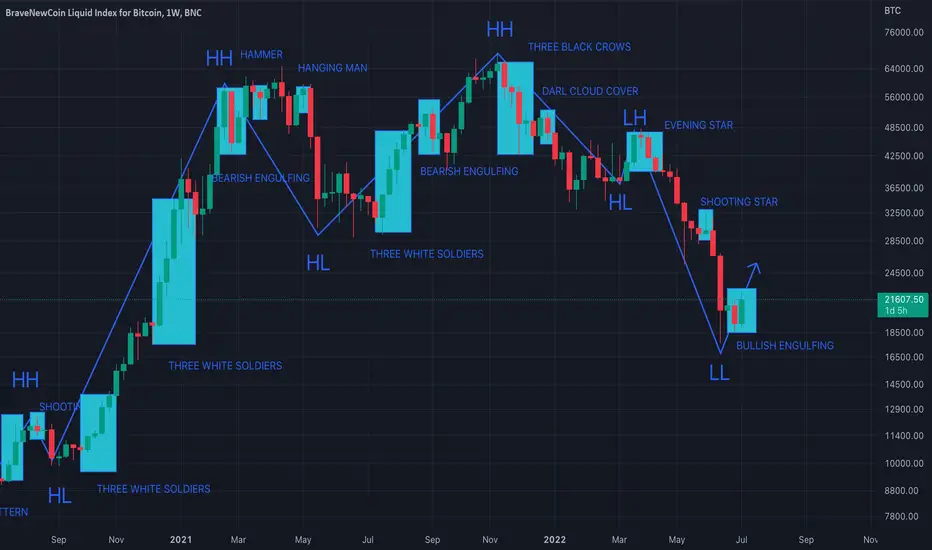
Bitcoin always makes a new high and then breaks supportMost of the time, the best way to understand the current trend is to look at the full picture. If you look at bitcoins past, you will see that in each cycle before a bull run, it creates a support and then launches off of that support to a new high. Afterward, it falls and not back to the trend line. It capitulates, falls through the old trend line and then starts a new pattern. Ever single bull run it has done this. Right bitcoin is close to the support that was created prior to the current bull run. Should we expect it to break the pattern this time? A lot of indicators are starting to flash green...but there is a major headwind with the stock market tanking, inflation high, the dollar skyrocketing. There could be a case for an anemic rally that would reset indicators, before one last push below the old trend line, pushing bitcoin lower where it will consolidate for the start of a new cycle. It makes sense to me.

Macro view of Bitcoin for the upcoming cycleCredit to @GABSBY for teaching me so much about macro and cycle analysis. This view is the product of what I learned from him.

BTC birthdayBTC 12 year birthday!
12k is a present.
but 12k should go below 10k later i think
Safe all!
Stone..


All the support is at 10K. Bear market ending November.Fractal of previous bear market, we can test the .618 at 10K, but need to continue up from there. Hedge your bets with this chart.

Bitcoin 2022-2030 Price PredictionBitcoin 2022-2030 Price Prediction
In 2030 the situation is not very good.

Bitcoin is right where is supposed to be!Looking at the history of bitcoin, the data shows this is nothing new and it's most likely the bottom. Buying has historical made you you look and feel like champion.
There is nothing guaranteed and there is Alloway's risk, without risk there is no reward.
Always invest responsible.

Bitcoin W Hi what iffffff btc break under 29k ? and confirmed ABC Expanded Flat where is next buy zone ? Well Look at Chart .. :)

Bitcoin BLX - Elliott wave since 2010 + Trendline still holding!- On the monthly scale there is a holding trendline with 3 touches established in 2015!
- The price is currently sitting on the trendline, so it is still very bullish at this moment.
- If we take a look at the RSI indicator, we are exactly in the buy zone.
- As per my Elliott wave analysis - we are in the massive wave 3 as you can see on the chart.
- Bitcoin is above 20 000 USD and above previous ATH from 2017 - again very bullish .
- We are currently above 50 monthly MA - holding since 2015.
- With my conclusion Bitcoin is a strong buying opportunity at this level.
- Look at my ideas about BTC .D and TOTAL crypto cap in the related section down below ↓
- For more ideas please hit "Like" & "Follow"!

BTC Long Term Quite Possible BTC could have bottomed at 17.5k
RSI lower than ever before
SRSI oversold as well and looking to slow down
3M is forming a bull div support on the 21MA.
Bear Div already played out

But this time it is different, again ! Right ?Everyone is in panic ... most of so called "TOP" autors calling for 15K and even sub 15K or delusional 10K targets again.
Im telling you that this could be your once in a lifetime opportunity ! (AGAIN)
Buying the FEAR and selling the FOMO gets usually rewarded well in the mid/long term.
When everyone is talking about end of Bitcoin and Bitcoin the digital gold not beeing a safe heaven ...
The whales are silently buying your super cheap asset which you´re selling underpriced in panic.
Cheers
Bitcoin , BTC ,R:R, money management, risk, reward, technique, style, trading, bitcoin , bitcointrading, profitable trading, profittrading, profit trading, secret, divergence, bull divergence, bear divergence, divergencetrading, divergence trading, trading strategy, how to trade bitcoin , bitcoin trades, bitcoin trading, make profit, take profit, trading strategy, trading technique, successful, successful trader, successful technique, successful strategy, successful secret, how to trade, trend analysis, technical analysis , indicators, rsi , relative strenght index, let it rain, successful life, easy strategy, easy trading, easy technique, make money, crypto investing, investing, crypto, cryptocurrency, cryptocurrencies, mentoring, money, chartart, beyond
BITCOIN HALVING
(MAJOR EVENT) countdown at the time of writing
636days5hours12minutes45seconds

Bitcoin bottom scenario - 2-weekly RSI at level Jan 2015Bitcoin bottom scenario - 2-weekly RSI at level Jan 2015
BTC closed the last 2-week-candle below the bottom-support-line - a novelty
The next 2-week-candle (11 days left) is very important IMO
A close above the bottom-support-line and everything might recovery more.
What do you think dear Crypto Nation?
*not financial advice
do your own research before investing

$BTC Bullish Consolidation / CypherA litle cluttered here but i tried to cram as much as i could into this chart data wise, and also to give possible targets if we do in fact bottom here even for a corrective move like this.
Just an idea, if we do bottom here we have a lot of room to correct bullishly without really putting the overall trend in jeopardy.
I think we can stay under the yellow supply line as high as about 28-30k
All 3 waves of the ABC correction from Novembers high have completed and diverged, including where we have bottomed.
You can see the massive volume gap from here to 28k, and the large amount of volume we have underneath us as support.
A .786 retracement would give us the Bearish Cypher would also fill that upper volume gap, but we have plenty of notable areas between here and there.
I drew the falling wedge on there because if we did get a sharp move back into that trend, a breakout of the supply line is confluent with the idea of the Bearish Cypher
Money flow has bullishly diverged twice, and is often an early, and statistically better way of locating a major divergence, in my experience.
RSI has also diverged locally a bit, but we would want to see a larger drive to really feel confident here.
The ADX indicates a bearish trend up top and volatility is contracting. This would imply a corrective or ABC move up. However if we bottom here, we could always see the volatility reset and then expand when the trend has flipped bullish which is indicative of an impulsive wave.
We havent backtested the next zone up from 28,800 either, which is about 37500 and nearly 100% up from here.
I also like the idea of the Bearish Cypher because that would also backtest the underside of the diagonal trend in white.
If youre a bear, that would create a lot of liquidity to really run for that downside with a continuation lower and ultimately spark a new bull cycle.
This isnt meant to be a trade setup, however if i were trading it, these zones are areas i would likely take partial profit, and reaccess if a continuation is most likely.

14 000$ BTCvery possible but not YETBitcoin can dump to 14k, its very possible that it will dump to 14-16k
But im 99% sure that this is local bottom, We can see 30k or even 38k before dump to 14000$
14k will be the strongest support at this bear market.
It will be hard to push bitcoin price lower than 14k.
Make sure to buy some SOL, BNB, ETH, Atom, Dot and BTC at this levels) We will be millionaires next bull run ))


Maro fib 1Part 1: Macro fib 1 on #btc. From fib is $0.09 to 0.01 this hits pretty much every major point on a macro scale and there is a pt 2 to this!

Bear entrance not allowed, BULLs timeAccording to the fib 78% cycles of retracements(repeating more than 10 years) from now on we shall see a bullish market ahead to 82/000 $ .

BITCOIN Macro fib tells all (Bottom is in) @MelvinsMovestwo macro fibs from high to lows and if we repeat what did last time then this is the bottom !!!!!! Let me know what you guys think?! also if you put the 34 & 89 ma on this when ever the 34 crosses under the 89 ma it signals bottom is already in! Dont believe me check it out for your self!

BLX The Next x100BLX - BraveNewCoin Liquid Index for Bitcoin determines a USD price point for one bitcoin at tick intervals of 30 seconds — calculated by extensive BNC-BLX methodology. This API offers a live feed and support for fine granularity historic tick-data for Bitcoin (BTC) market trading, dating back to the beginning of trading on MtGox in early 2010.
