$ESTY surges on strong data
Etsy outperformed the market on Friday after releasing impressive data,
Will be on the lookout for continuation Monday
E2TS34 trade ideas


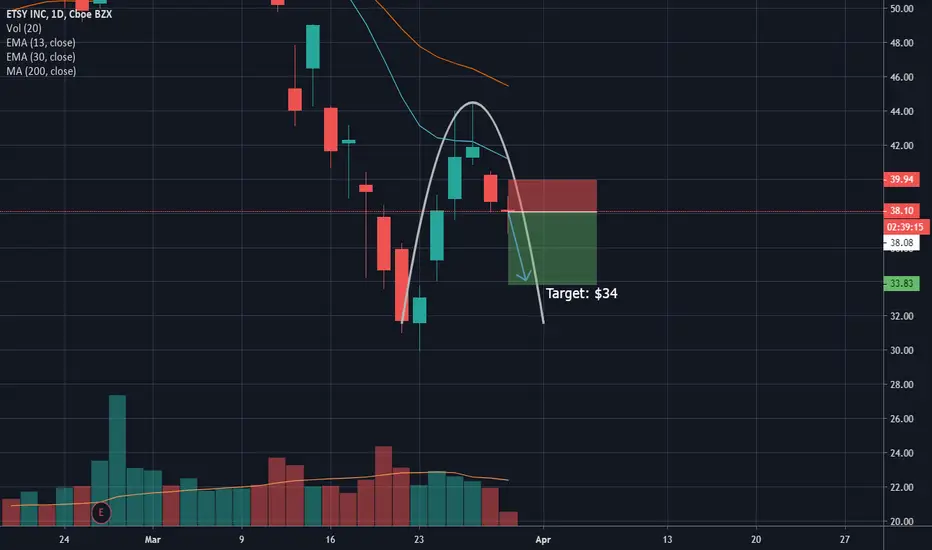
ETSY Round DownETSY looks like its heading back to last weeks lows. It has bounced off the 13ema as resistance and started forming its rounding pattern to the downside. The 200 sma on the weekly chart is resting at the $34 range, which is why i set my target there instead of the lower low.
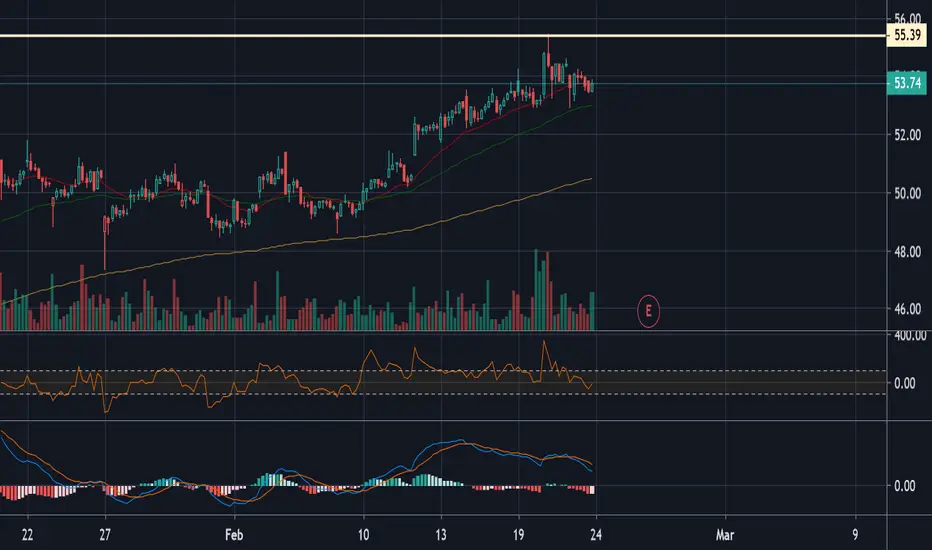
Long entry above boxETSY still strong on the work from home theme.
Long above green box stops below green box..
Possible secondary entry at the longer term 382 at 55ish.

ETSY rally incoming?ETSY is a great company, a nice platform for D.I.Y.ers and home creators, buyers and sellers. I have spotted some similarities in the price action with current price action and action from april of 2017, before it ran up almost 65%. although we are currently in a descending broadening wedge (a bullish pattern) so I would want to watch for a correction before breaking it, which leads me to believe we could be forming a massive inverse head and shoulders which could possibly break up to the 80 dollar area. look out for a break up out of the massive falling wedge, I'm looking for an entry at about 67, exit at 85, that is my plan, it is not financial advise!

ETSY BounceETSY has come into a resistance level at $61.3 range. It is at the moment overextended, meaning it will have to take a breather before it can actually breakout of this level. There is also decreasing volume on its upward movement, showing that it is running out of steam. I think it will pullback to its moving averages around the $56 level


Etsy short squeeze potential,$etsyGiven the market conditions, the afterhours 12% gain is highly significant, but has been halted by the Fibonacci 0.5 level. The company is stay at home benefactor and not as dependent on mass production, so a little more immune to consumers staying indoors.
Short squeeze potential 13.28%
Earnings Surprise
earnings of $0.25 per share, beating Consensus Estimate of $0.17 per share.

Etsy on alert for better times $etsy
Alert set for break above $57.50 for possible long , dependant on market stability
P/E ratio 81
Short interest 13.46%
Company Profile
Etsy (NASDAQ:ETSY) rallies after topping Q4 estimates and setting full-year revenue guidance ahead of expectations.
Etsy sees FY20 revenue of $1.04B to $1.06B vs. $1.02B consensus and FY20 GMS of between $6.2B and $6.4B.
During Q4, the online retailer topped revenue expectations for both the marketplace and services businesses. Etsy ended the quarter with 46.4B active buyers (+17.5% Y/Y) and 2.70M active sellers (+27.6%).
ETSY +10.48% AH to $56.00.

Etsy TradeMapped out key lines of support and resistance. and ER is coming up thursday, Will be checking IV in the morning and see if there is a possible Lotto play to go here. For now, I am looking at the play below
Calls over $56, puts under $53.
ETSY confirms cup and handle breakout?If this plays out the way I think it will. I'll be looking at the resistance levels and targets marked for pullbacks or S&R flips (support and resistance flips). So far, my cup and handle theory looks to be holding. If it doesn't hold, I'd be looking to retest the neckline of the cup and handle breakout for support. if that breaks, well hopefully the support on the VPVR will hold.

Etsy reversal to continue $etsy
As earnings approach the stock has rallied as optimism gathers for a good festive season for etsy.
Looking for a long at approx $54.00
Upside target $59.00
Dropping 200 day moving average possible resistance.

ETSY breakout?If ETSY has in fact broken out of what I suspect to be a cup and handle formation, then I would say 63.92 is in the cards for it's stock price. It recently closed it's most recent gap and we are heading towards earnings come the 26th of Feb 2020. I will be keeping an eye on this. I am a little concerned about the bearish crosses of the EMA's, but it looks likely to cross back over towards the upside shortly. I am anticipating upward momentum, as they have beat earnings expectations multiple times in the past.

ETSY Short ETSY at beginning of downtrend. Distribution up top and currently pushing up against channel, looking to make a large move down. There is a good size unfilled gap from previous bull channel. Targeting bottom of gap with weak resistance to this point. Peace out playas.

ETSY - Current Long position, and Potential Gap TradeThe stock ETSY has hit the 50% Fibonacci resistance line and bounced off of it. The Fib line represents a trend that had been in place from February 2017, around $9 price, until the high of $73 in February 2019. This resistance line is very strong, and can represent reversals along with other indicators.
Currently we see on the 1D, 4H, and 1H charts, that the 5d MA has crossed over the 8d MA, potentially signalling bullish movement. I have opened a trade at $43.80, with a short to previous resistance of upward movement (about $42.80). I have a 50% sell at $46, and the other 50% will be aiming for the Gap Trade that could be in play. The downward movement on October 31 represented a $8 drop in price, which often eventually finds it's way back to the starting price, before resuming previous trend. IF the $46 trade hits it's mark, I will set the Sell at $52, and will be moving up my stop loss to $43.80.
Depending on how the MA plays out, I will keep this trade open to continue trade #2.

Etsy Gap fill tradeEntry level $49.50 = Target price $51.80 = Stop loss $48.48
Short interest = 12.57%
P/e ratio 59
Average Recommendation: Overweight Average Target Price:$64.75
15 BUY
00 OVERWEIGHT
01 HOLD
01 SELL
Company profile
Etsy, Inc. engages in the management of an online marketplace. It operates a technology platform which allows sellers to manage and scale their business. The company offers handmade products such as shoes, clothing, bags, and accessories. It operates through the United States and International geographical segments. The company was founded by Haim Schoppik, Robert Kalin, Jared Tarbell, and Christopher Maguires in June 2005 and is headquartered in Brooklyn, NY.
PLEASE GIVE US A LIKE IF YOU FIND OUR CONTENT HELPFUL, IT IS REALLY APPRECIATED


ETSY - LONG SETUPSHOWING EXHAUSTION ON RSI. GAP FILL AROUND 52 ish. DOUBLE BOTTOM ON HISTORICAL SUPPORT LEVELS ? PRETTY LOW RISK ENTRY HERE.


$ETSY long vs 38. After a significant pullback I like this name as a potential long candidate for 2020.

$ETSY Bullish pattern completed expected bounce to 52.8 So this is bullish pattern suggest new uptrend start from current levels and targeting 1.62 fib on long -time frame which around 73 ..... but now lets see more confirmation and get in targeting 50s - 52.8 with projected profit around 15-20$ from levels of 41-42 .. at least to close last earning gap .. all indicators are oversold and ready to move up .. also stoploss is near by at 39.8 .. actually, I was tracking ETSY after earning report and that sharp drop then i draw this pattern and forgot it now i checked it was running perfectly .. good luck

ETSY back on the shopping list. Ok after the a earnings call from hell the stock tumbled but looks to have found some solid ground.
Entering into the holiday season we believe this selloff presents a nice long opportunity.
possible entry level $47.00 or $43.75
possible targets $52.00 or $46.00
Stop loss $45.77 or $42.83

$ETSY Bullish Pattern best entry at 39.33 with goal at 50Strong selling after earning . going down to main support level at 39.33 if reached there On month of Nov then this Bullish pattern will be formed exactly .. and expected good bounce to at least close earning gap near 50.7 .. also possible bounce to 47.4 then continue drop to reach 39.3 or 40 .. to be watched and get right moment to jump in ..Most indicators already corrected and inside buy levels..
