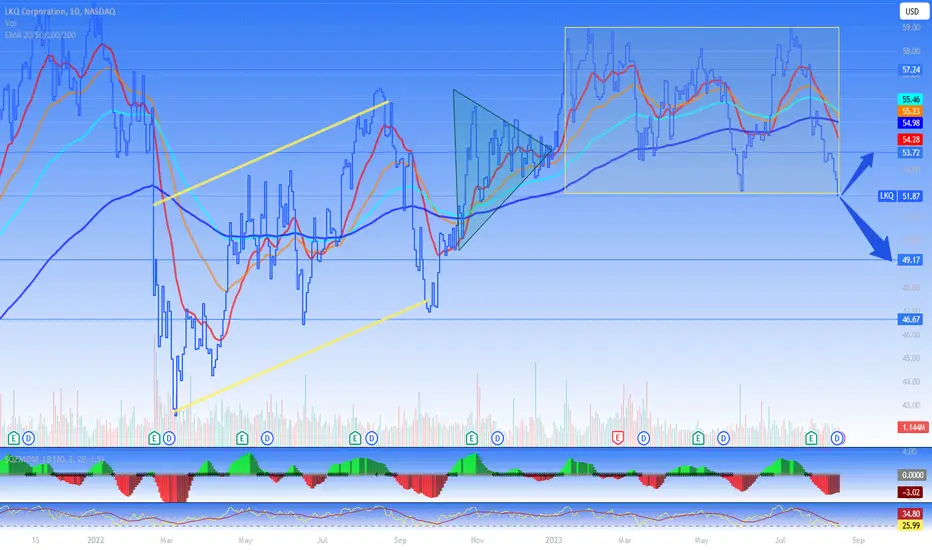
Bounce back into this channelProfit favours the brave. Short term upwards.
Looking to enjoy some gains. Before continuing to take a long term downtrend position
15.44BRL
4.58 BBRL
67.41 BBRL
265.01 M
About LKQ Corporation
Sector
Industry
CEO
Justin L. Jude
Website
Headquarters
Antioch
Employees (FY)
49 K
Founded
1998
ISIN
BRL1KQBDR005
FIGI
BBG00R4Z8Z11
LKQ Corp. is a distributor of vehicle products and its parts to repair, maintain, and accessorize automobiles. It operates through the following segments: Wholesale-North America, Europe, and Specialty. The Wholesale-North America segment includes Glass and Self-Service segments. The company was founded by Donald F. Flynn in February 1998 and is headquartered in Antioch, TN.

UpdatE: LKQ, Change Stop Loss=51(+12.45%)NASDAQ:LKQ
UpdatE: LKQ, Change Stop Loss=51(+12.45%).
Take Profit without change. Good luck everyone.


LKQ's fate to be decided today. LKQ was on an uptrend from March to October 2023. Nov-Dec 2022 was the period of consolidation. LKQ broke out in January 2023 but has been in a rectangular formation since. RSI is now nearly oversold. But the overall market is weak. Either ways, LKQ will come out of its rectangular formation today.
LKQHello ladies and gentlemen, according to my chart analysis of the LKQ, there is a high probability of a decline towards the 46.24$ level in the next few weeks.

LKQ - Hidden Divergence - BullishOn the chart of LKQ, we can see a forming ascending triangle and we can see hidden bullish divergence on daily timeframe.
An ascending triangle is a bullish formation. The pattern gets validated when the price breaks out of the upside of the pattern.
By using the Relative Strength Index we can hi

$LKQ with a Bullish outlook following its earnings #Stocks The PEAD projected a Bullish outlook for $LKQ after a Positive Under reaction following its earnings release placing the stock in drift A with an expected accuracy of 100%.

$LKQ with a Neutral outlook following its earnings #Stocks The PEAD projected a Neutral outlook for $LKQ after a Negative over reaction following its earnings release placing the stock in drift C with an expected accuracy of 57.14%.

LKQ: breakout watchLKQ is currently at a resistance point of a downtrend channel that started back in December 2021.
Watch for LKQ to break that trend line. A break would mark a potential reversal of the downtrend.
I'll be entering a long position on the break, with a stop at 49.50.
The ideal situation is if w

$LKQ with a Neutral outlook following its earnings #Stocks The PEAD projected a Neutral outlook for $LKQ after a Positive over reaction following its earnings release placing the stock in drift B with an expected accuracy of 75%.

See all ideas
Trade directly on the supercharts through our supported, fully-verified and user-reviewed brokers.

