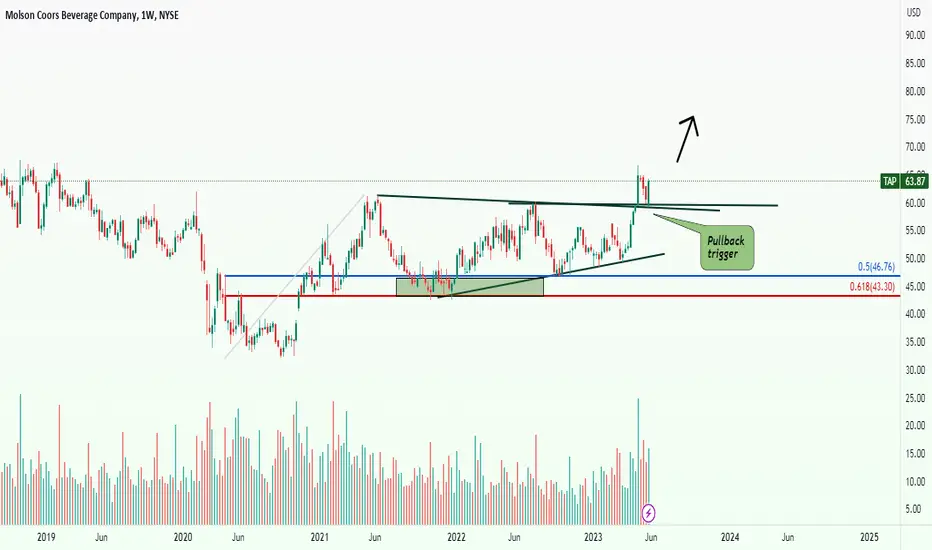
TAP flushed on a good earnings beat into support LONGTAP appears to to have fallen into support on a good earnigns beat Perhaps traders were
expecting a better beat. It is now 15% below the resistance zone where shorts will take
positions and longs will sell- off. TAP has sales and consumer loyalty in its brands. It is
free of the controversi
Key stats
About Molson Coors Beverage Company
Sector
CEO
Gavin D. K. Hattersley
Headquarters
Golden
Website
Founded
1786
ISIN
BRM1CBBDR003
FIGI
BBG00R4Z8DQ3
Molson Coors Beverage Co. is a holding company, which engages in the production and sale of beer. It operates through the following segments: Americas, and EMEA and APAC. The Americas segment operates in the U.S., Canada and various countries in the Caribbean, Latin, and South America. The EMEA and APAC segment operates in Bulgaria, Croatia, Czech Republic, Hungary, Montenegro, the Republic of Ireland, Romania, Serbia, the UK, various other European countries, and certain countries within the Middle East, Africa, and Asia Pacific. The company was founded in 1786 and is headquartered in Golden, CO.

TAP ( Coors Molson Miller ) Ready for Bullish Continuation?On the daily chart, TAP was on a good trend up heading into earnings which were favorable.
It is consolidated since just after earnings in a " high tight bull flag pattern" Volume has been
healthy with many buyers and seller trading shares in a tight range channel. The stochastic
RSI is now at a

Molson Coors Brewing Company_buybest entry
100 % correction
low risk
R:R=1:6
Trade in the direction of the market
Godd luck.

TAP Buy opportuinty Uptrend
Breakout of a level and pullback to it is a good and sure position especially after a suitable bullish candle over the S/R zone or TL. Set a sure SL for it and enter to buy position.
TAP - start of bullish trend?TAP bottomed in Sept 2020 and began to move higher till 7 Jun2021, after which it made no further progress and pretty much churned sideways in a wide range for the next 11 months.
Finally, on 2nd May this year, it began to propel strongly above the neckline due to positive earnings surprise. Howe

Another woke beer seems to be losing valuation as a resultSuper-smart marketers at Cors launched a man-bashing ad back before Budlight's debut. Only a few would pay attention to it in today's environment, it isn't that shocking.
However, due to Budlight's wildly extreme that sparked a total boycott of the brand, fake beer consumers became a lot more sensi

Coors bucking the trend and taking market share from woke Bud Coors (TAP) looks like it will be taking the back the HKEX:75 level after Buds woke ads have likely offended some of its customers. Customers will be voting with their wallets, lets see how this will do against the macro environment.

$TAP with a Bearish outlook following its earnings #Stocks The PEAD projected a Bearish outlook for $TAP after a Negative Under reaction following its earnings release placing the stock in drift D with an expected accuracy of 57.14%.

TAP: BEAUTIFUL ARC ON THIS CONSUMER DEFENSIVE STOCKTAP (Molson Coors), a beverage company. Good value stock.
Sector: consumer defensive
It's forming a beautiful arc . Can we complete it and reach USD 61?
Risk/Reward is good here as you can put a stop just below 52.
I'm in for a swing.
Trade safe!

$TAP with a Bearish outlook following its earnings #Stocks The PEAD projected a Bearish outlook for $TAP after a Positive over reaction following its earnings release placing the stock in drift B with an expected accuracy of 60%.

See all ideas
Trade directly on the supercharts through our supported, fully-verified and user-reviewed brokers.


Curated watchlists where M1CB34 is featured.


