SPOT is heading downSPOT is currently way overbought and last time it reaches this level it dropped $20 so it could possibly drop that or more. If your looking to buy SPOT wait for the pullback to happen then scoop it up at prime price. PLEASE COMMENT WHAT YOU THINK!
S1PO34 trade ideas

SPOT Rubberband SnapbackSPOT is oversold on it's hourly and daily chart on the stochastics as well as its bollingerbands. Its exceeded the high bollinger band on daily. The daily chart has shown declining volume on the run up. It has also run up into its all time high which will have excess supply on top of being overbought. I expect this to be a quick 1-2 day swing back down to the 161 range.

Long SpotifyStrong growth during COVID outbreak.
We are basically looking at a NTFLX in the audio segment, but with a way stronger monopoly.
While NFLX has taken off during COVID, SPOT has moved relatively little.
On the technical side, strong upward trend, about to retest previous resistance level of around 160$, already tested 3 times in the last 1y.

Again SPOT is at 159It's been here several times before. Once again if it exceeds 159 it should be very good for the longs.

$SPOT looks likt it got wings this time to flyRinse and repeat pattern, but this time maybe a bit different

SPOTify breakout?If Spotify NYSE:SPOT crosses 159 should be significant upside. Last earnings was flat instead of a 51 cent loss.

Welcome to the Space Jamlooking for close above 159.00 to confirm bullish sentiment, invalidated if it falls below all time trend line. great company model and viable product in the foreseeable future. Solid subscriber growth from earnings may be the catalyst to have this stock retest highs.
*not investment advice & trade at own risk!

SPOT breakout failure ?NYSE:SPOT has been trading in this range since December 2018.
Yesterday we saw a gap up on a volume spike at the top of the range.
Typically that would be a very bullish signal if it closed outside of the range with a solid candle but as you can see on the chart, it closed in weakness at the bottom of the range.
Let's take a look at the fibs action :
High of yesterday's candle almost hit the 1.618 (165.03) and reversed to close just above the 1.272 (154.54) @ 155.78
A close today below the 1.272 and the close of yesterday might take us for a ride to fill the gap below back to the 142-143 area

SPOT - SpotifyLONG
Entry 1: 134.x (Reward/Risk: 1.1)
Entry 2: 121.x (Reward/Risk: 2.1)
SL: 105.x
TP: 149.x

SPOT Long, after breakaway Gap and down trendline break Condition:
1. Two breakaway Gaps (G1, G2) in one week. They show very strong strength.
2. Two down trendline break (TLB1, TLB2)
Entry at today Gap up open before 128
Stop: 125 (below Gap G2)
Target1: 140; risk/reward=1:4
Target2: 148; risk/reward=1:6
This is a trading school homework. I need 6 months to practice trading plan.
If you like it, thank you for your support. Please use SIM/Demo account to try it, until my trading plans get high winning rate.

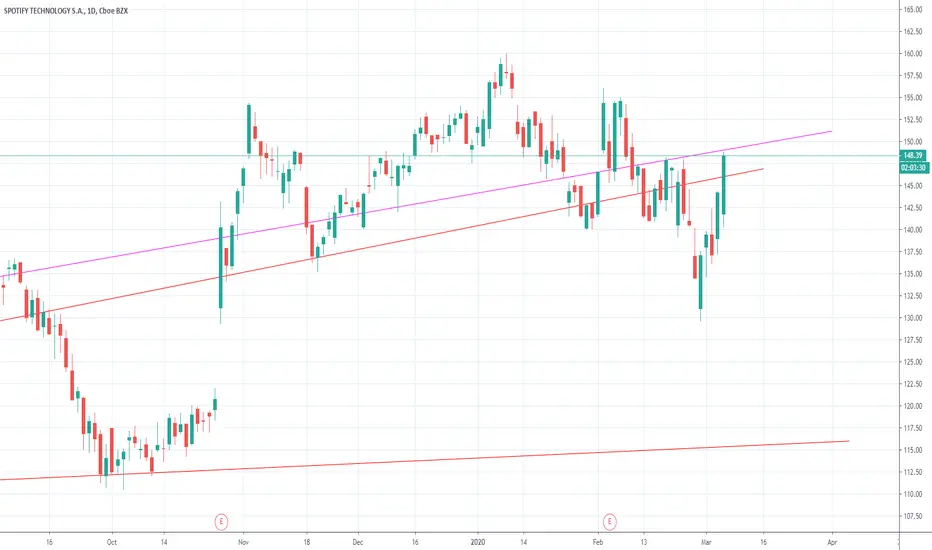
Spotify currently in a channelSpotify has been in a channel for what looks like over a year. There are two lines of support and it has recently bounced off both of them. I expect it to rise slowly up past EMA-50 and hopefully reach the top of the channel. RSI is not too high, and MACD is giving a buy signal.
Despite recent COVID-19 concerns, Spotify should be financially ok since they are on online service and, more importantly, people will likely be using it a lot more since everyone is at home.
EPS is also coming up in May, and I fell confident that it'll be either met or beat.
Most of the analyst recommendations that I found on Marketwatch also agree to either buy or hold SPOT.


Spofity earnings trade
Bullish bounce of mid channel support.
MACD | RSI | Stochastic in reversal.
Moving average support.

Oh SPOTIFY you are not looking goodLook Daily under 200 EMA
20 will be crossing 50 EMA
Look what happened around late August.
ER whispers around the block not sounding the best.
Am Short. Look at the strong support Nov 18' & May 19' where there is ALSO a gap that can be filled around 120. That's my target.
Thanks for listening.

Very Bullish SPOTLooking for a nice pop higher here for SPOT. The 154.11 level is the initial target, which could come in the very short term. An additional target level to the upside is the 157.89 level. Simply put, bullish.

Spotify diamond topSpotify is showing mixed signals with the formation of a diamond top which is indicative of a bearish reversal, evident on the chart. Also, formation of an island top which are a quite reliable bearish reversal chart pattern. The uncertainty in this chart may be evident to investors which choose to capitalise on this or sit out.
Personally I use Spotify myself..

NYSE: SPOTIFY - Price tested the 200ma and has formed a IHS which should open a new leg up
- A break below 141.25 will target gap close below on the failed pattern trade
- MANAGE YOUR RISK -
Disclaimer: All ideas are my opinion and should not be taken as financial advice.
NYSE:SPOT


LONG SPOTIFYCompany showing solid Y/Y growth. We are testing long time overhead resistance. Wait for a break and long to $168. 13-15% upside. Coming off a good ER and bouncing off critical support.
Y/Y
Revenue 1.73B 28.03%
Net income 241M 460.47%
Diluted EPS 0.36 56.52%
Net profit margin 13.92% 337.74%

Long Spotgood R:R back to the resistance. BUT, I believe it's gonna try to fill the gap and possibly up and above

