AMD break or fake?AMD at breaking out of this trendline resistance at a big demand zone can it squeeze this local supply and see the higher 80S
AMD trade ideas

AMD's next short term fate is dependent on ER...kinda obvious :)ER would decide the direction of the overall next cycle. Will it be trending upwards or if it will be trending lower. I did sell some few days back but will wait for ER to get my next heading with AMD.
Disclaimer: My opinion on stocks are mine alone and not to be taken as Investment advice.

AMD heading toward support areaFor those of you who are following along with me on my little obsession with AMD, the past week was pretty exciting for those who were shorting the stock as the price dropped out of that short-covering rally like a rock for a $9.46 gain.
AMD is now reaching a very uncertain area with 3 support levels to get through and it's actually touched an ascending trend line, so I'm expecting a few bounces to occur. My first short target is the middle of the support area at 59.80, but with hindsight, it should have been 63.62 which is the first support level below the 2-year line. The ultimate target is still 50. It's very possible AMD will make a double-bottom before it gets to 50 so I would look out for that. I'm still bearish at this point.
Disclaimer: I am not a financial advisor, and the above statements are not investment advice. My comments are only intended for educational purposes. You are solely responsible for your own trading decisions.

AMD: Key Reversals, and Short-Covering RalliesAMD has been in a bear market since December 1st, 2022. For those of you who took a short position, you have had to endure three major short-covering rallies. The first short-covering rally which began on December 12th may have made you reconsider your decision to short in the first place, and you probably got out at some point. But when is the best time to get out and possibly go long? Identifying key reversals can be helpful in these situations.
In a bear market, a key reversal is when the price makes a new low but closes on or near the high (the opposite is the case in a bull market). A bar chart can help you see this better. I've placed black arrows under the obvious key reversals on the daily chart. The orange arrow shows a key reversal that may not fit the definition exactly since the price closed just above the middle and not very close to the high.
These rallies only lasted a couple of days each, and since the key reversal can't be identified until the end of the first day, the opportunity to make gains with a long position only lasted one day.
An opportunity to go long has just presented itself on January 6th with a key reversal. I'm expecting a rally on January 9th. The question is, will this rally continue to the upper resistance line, or fizzle out in a day or two and retest the support it bounced off? I'll be watching.
Disclaimer: I am not a financial advisor, and the above statements are not investment advice. My comments are only intended for educational purposes. You are solely responsible for your own trading decisions.

Is AMD's recent rally coming to an end?Perhaps.
AMD has rallied for the past 8 trading sessions. The first session was on January 6 and ended with a key reversal (new low, closed near the high). Today, another key reversal has occurred (new high, closed on the low). This would indicate that AMD is likely to reverse direction and head lower. I'm going to say it will reach 64 by the end of January or sometime in February. I'm usually a bit too optimistic, so I'm giving myself some breathing room.
AMD tends to correlate with Invesco's QQQ ETF which is heavy in technology stocks, so I often check to see if QQQ is leading the way. As it turns out, QQQ had an even more prominent key reversal today. To me, this just confirms what I think is going to happen.
Of course, I could be wrong. Not all key reversals work the way you want them to (see the red dots in November).
We have just reached a 2-year-old support level that may now become a resistance level between 72.80 and 73.75 (the thick blue line and thin black line). I will be watching closely. If AMD doesn't respect the key reversal, it could break through that area and revisit it a few times like it did in November and December.
Disclaimer: I am not a financial advisor, and the above statements are not investment advice. My comments are only intended for educational purposes. You are solely responsible for your own trading decisions.

AMDThe pressure against money markets has been declined since the actual inf. data is approximating the expected inf. data. Avg cost is 67 usd.
Not an investment reccomendation.

Advanced Micro Devices Analysis 23.01.2023Hello Traders,
welcome to this free and educational analysis.
I am going to explain where I think this asset is going to go over the next few days and weeks and where I would look for trading opportunities.
If you have any questions or suggestions which asset I should analyse tomorrow, please leave a comment below.
I will personally reply to every single comment!
If you enjoyed this analysis, I would definitely appreciate it, if you smash that like button and maybe consider following my channel.
Thank you for watching and I will see you tomorrow!
You can also check out my previous analysis of this asset:

AMD First Day of a Breakout?AMD could be on a first day of a breakout. Finally broke out above daily cloud. Could hit 79. Also bb finally curling up.

AMD daily - symmetrical triangleAMD is inside the down channel and last 5 months AMD is consolidating at the same price. Inside the channel, it formed a symmetrical triangle. Friday's move was a strong green day with decent but not great volume. This leg-up is confirmed with volume especially the first two days of it.
Price manages to stay above 8 and 50 days MA which is bullish, and only BigRed is above the current price.
RSI is neutral.
MACD both histograms and lines are neutral.
Overall: AMD's move above blue trend lines would trigger a buy signal. The buy signal would be triggered by crossing the blue dotted trend line, but it should be on volume bigger than 20 days average volume. If it doesn't cross price could consolidate inside a symmetrical triangle waiting for the report and next move.

AMD continued momentum$AMD soar last week as market pivots due to inflation data from last week. AMD setup is looking bullish here as it entered the squeeze zone going up.
as you ca see in my chart. I marked some of the potential entry and exit if the stock extend its rally tomorrow. and also the potential entry for puts if
the stocks decides to pull back.
Make sure to set your alerts on those price target so you wont miss the move.
for more details AMD analysis. check out my streams.
Honorable mentions: GOOG AMZN QCOM NVDA DAL BA ( they all have almost similar setup)
=========================================================
Hi and welcome to this free technical analysis . ( mostly momentum play )
I am going to POST where i look for possibly entry and exit for intraday or scalp for trading.
I will try my best to make the idea short and simple as possible.
If you have any questions or suggestions on which stocks I should analyze, please leave a comment below.
If you enjoyed this analysis, I would appreciate it if you smashed that LIKE or BOOST button and maybe consider following my page.
Amd Amd to me on a weekly standpoint cpuld
Be setting up for a very bullish breakout. Seems from my veiw we had a downtrendinf reistance causing lower high after lower high. We recently popped above this extreme reistance after a beautiful bull flag considlation formed just under that reistance. As of the last 2 days price came back to backtest that previous reistance as new support around 67.50
We made a W pattern on short term chart 15min which I entered my long trade off of. Started averginf in around 68.40 68.65 and final entry 68.90
We saw the push up with the rest of the market but 70 $ phycological level will be the first area to watch. Basically overall it looks that we could be on a rally up to 79$ area. Of course amd has to pop above that and hold to show a new short term higher high which would actually start to complete this W pattern on the daily we have started with a higher low.
Overall I am bullish AMD and I think we saw the bottom come in.

AMD LONG to 94!
This chart is textbooky in terms of resistance and supports. You can see clearly that once it has a support/resistance, there are multiple rejections at those price zones.
It recently broke out of an Ascending Triangle which is a bullish pattern. The next resistance level is at around 94usd. I doubt that it's not going to reach that price since there is no visible resistance on the way.
I believe this will take between 2-4 weeks.
I try to keep this as simple as possible, but if you have any questions then feel free to ask.
This is not financial advice, do your own DD!

AMD Bear Trap?If you read my other idea about AMD reaching 50 by January, you will notice that everything seems to be playing out as expected.
I'm still learning to analyze chart patterns, and I asked someone who is teaching me to take a look at AMD. They acknowledged the downward channel and the recent triple-top pattern. But they also pointed out that the triple-top was in a support area going all the way back to 2020. If you look at the red line I drew, you can see it clearly. With that line in place, the period from Oct-Nov 2022 looks like a bear trap. I did note in my other post that it could be a cup and handle pattern. Either way, it would indicate a price move to the upside. So, now I have a dilemma. Do I continue shorting AMD or go long?
After today's drop of -1.88, I'm still short and also encouraged that I'm still "right" in my prediction. Lately, I've been missing opportunities because I wasn't fully committed to my own analysis. I need to believe in myself. So that's what I'm going to do this time. That doesn't mean I won't be watching to see what the market is saying. I've been told that the market is always right.
What do you think?

Advanced micro device /UPBuy long position at monthly or weekly
Stop loss :59.30
Take profite: 85.03

Is AMD running out of gas ????AMD been on a run for a week now and it looking like it's topping oy on the 4hr chart with earning coming up AMD like to run down leading up to earning before it take off so lets see how this will play out over the next few weeks


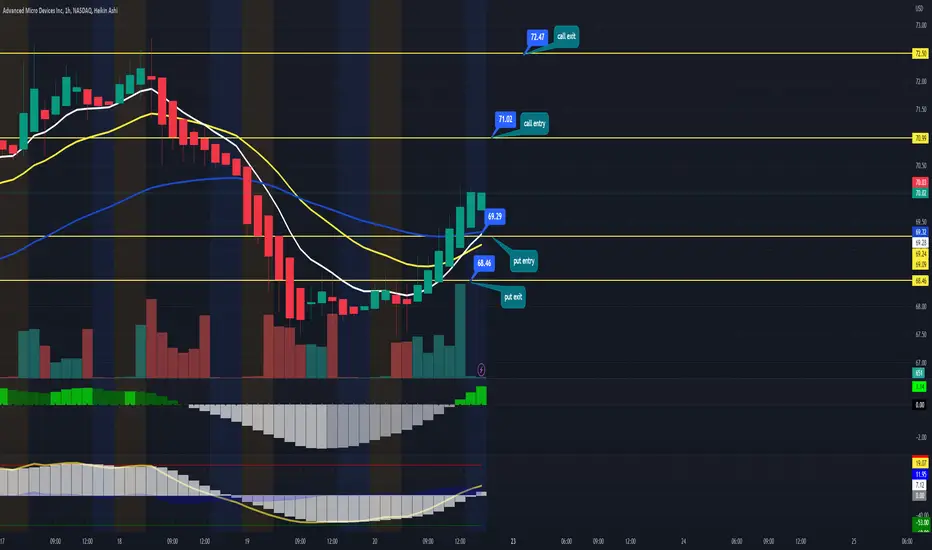
AMD to the moonseveral of semiconductors stocks and majority of the market are trading higher amid overall market strength following December CPI. which showed sign of cooling inflation.
$AMD is still below 200 moving average. market sentiment is still looking bullish specially with this price range of AMD and other tech stocks company. also, AMD is entering
the squeezer which is could potentially rally.
$AMD typical price move is about $2.00 to $4.00
Below is my price level entry and exit for intraday trading or scalp play.
the stock looks extended in 1hr chart. I suggest to wait about 30min to 1hr at the
opening bell before following the stock.
============================================================
For calls; buy above $71.52 and sell at 173.30 or above
For puts, buy below $69.23 and sell at $68.63 or below
============================================================
Bot generated technical analysis:
Last price: 71.00
1st resistance level: 71.0
2nd resistance level: 72.31
1st support level: 69.79
2nd support level: 68.57
Honorable mentions: $WMT technical looks good and momentum still looks solid.
=========================================================
Hi and welcome to this free technical analysis . ( mostly momentum play )
I am going to POST where i look for possibly entry and exit for intraday or scalp for trading.
I will try my best to make the idea short and simple as possible.
If you have any questions or suggestions on which stocks I should analyze, please leave a comment below.
If you enjoyed this analysis, I would appreciate it if you smashed that LIKE or BOOST button and maybe consider following my page.

AMD WEEKLYRULES:
-If price break Point 2, 4, 6, or 8 cancel the setup
-Price needs to break Point 1, 3, 5, or 7 to confirm the setup
When price reach the 100FE(BLUE BOX) it normally does a pullback/retest or reversal
The market can Truncate(fall short)


AMD | Probably the $56 Price Zone will push the price up againAMD | Probably the $56 Price Zone will push the price up again
AMD reached its peak price on November 30, 2021, and since then
the price developed a clear downward trend.
Currently, we can see that the price has completed a wedge pattern and finally
buyers showed interest in AMD near the $56 price zone, which also responds to the time before covid.
We may see price increases in this area again, but I don't expect anything big.
Thanks and good luck!

AMD double-top indicates a fall back to 50 by JanuaryAMD has been trading in a descending channel for the past year. A double-top has just formed near the upper resistance line. This would indicate that the price will go lower shortly. It's possible a triple-top could form before this happens. It's also possible that a cup and handle have formed and the price will break out from the channel. But based on the past pattern cadence and the angle of previous price drops, I expect AMD to hit 50 sometime near the end of December or the beginning of January. I'll be watching closely over the next couple of trading days to confirm.

AMDMID-TERM: Higher low double bottom, hidden bullish divergence, wedge breakout. (not financial advice)

May go up in near future.Although a short term bounce is on cards, the current trend indicates it will start trending lower towards end of Jan.. Hope we can break above Fib resistance levels
