BB/N trade ideas

Imposing breakout of the horizontal resistance lineIn my past ideas I shared chart patterns like double bottoms, triangles and trend line breakouts but this is very different. Generally I do not like to use sophisticated terminology in an a attempt to sound intelligent. And in this case of study the only thing iI need to say is that the price finally is surpassing the 12.00 level after more than four years of oscillating in a channel, the other aspect here is that the price is trending and is easy to appreciate that is making higher highs and higher lows because in some occasions when I watch the behavior of channels like this sometimes the price breakout the resistance or support line but it's mere volatility. For not fall in a fake breakout or bullish trap I need to appreciate a trending behavior and use the moving averages and identified that the moving averages are becoming spacing and have some inclination. If I watch back in the time the period between 2015 and 2017 the moving averages looks flat and braided. And of course I always need a weekly candle closing above resistance line and then wait for your respective pullback or consolidation above the 12.00 price level so that it is done to the idea that the bulls are in control.
Others aspects i like of this company is that the technology industry in the past years have been in bull trend save this company and the majority of people only speak about apple, google, amazon, Facebook, and other fancy names. And the analysts only write bad things about this company.
I forgot to say one thing the resistance line was broken with a gap and this is a breakaway gap in a relevant price level accompanied with a bullish sentiment in technology industry
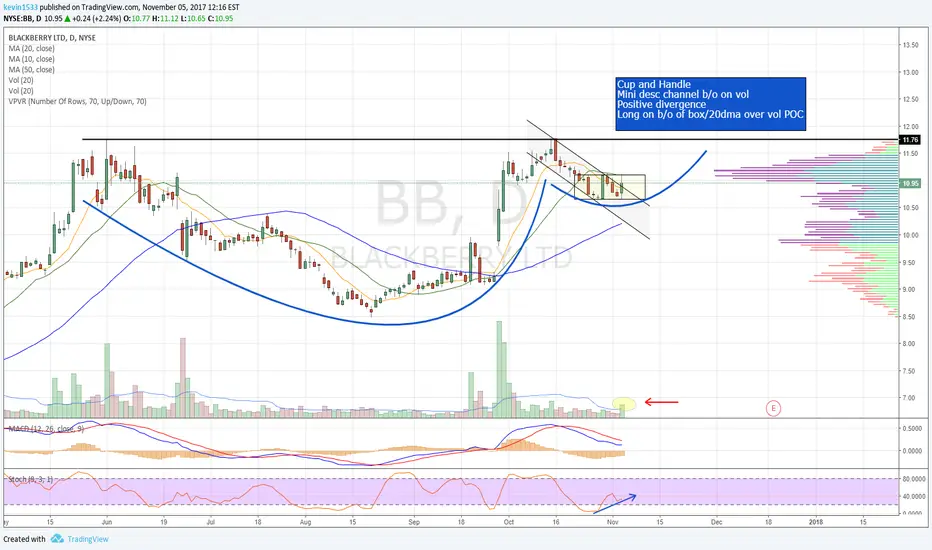
Look the gap in the daily chart
www.tradingview.com
Patience, and weekly charts :(

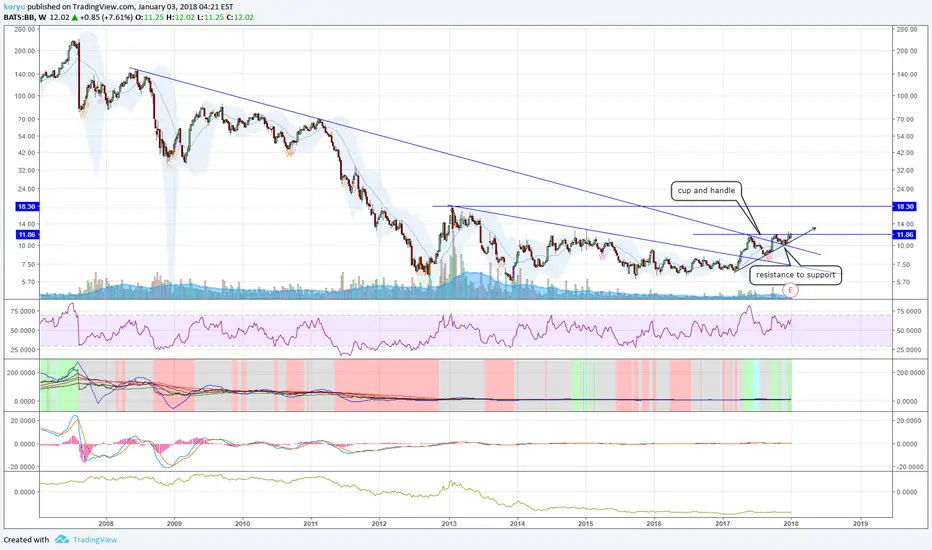

Big Breakout for Blackberry todayBlackberry gapped higher on the open today, clearing $12.00 for the first time in nearly three years. At the same time, it has broken out of a sideways channel and an ascending triangle, all signaling the start of a new uptrend. The channel measures toward $13.80 while the triangle measures toward $15.60.


Blackberry - To start opening long positionsIt has been accumulating for really long time and it looks good to great the long-term resistance.
To open long-term positions the closer it gets to $8.00
If it doesn't go to the bottom and it breaks $10/$11, wait for a pull back and volume confirmation for opening of positions.


BB Bearish engulfing candle patern, trend reversalBB may reverse if trend line is broken. Bearish engulfing candle shows a strong will for a down trend.
If BB breaks the bullish trend line, may close the June 17th gap.

Trading Support and Resistance -- Horizontal LinesReading the charts for price action, can it be this simple? Take trades at one level with stops on the other side and target to the opposite level.
