ISRG trade ideas


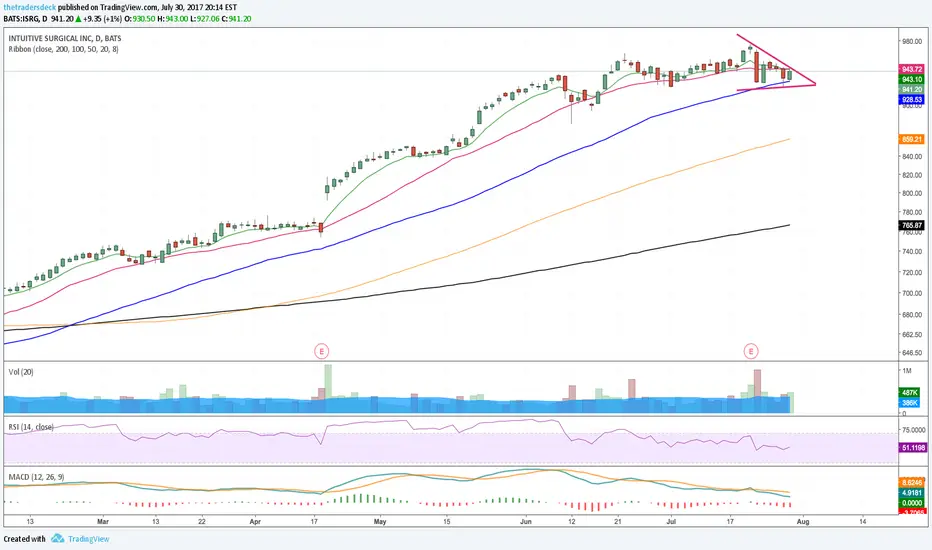
ISRG Correction I looked at the 2 year history of ISRG and found that old trends are still prevalent in current ISRG Stock trends. Looking at the trend lines, it looks like ISRG is a little over bought right now. I predict that ISRG will hit a correction once it's between the red lines, then it will bounce at the floor between the green lines.

Just bought August put options on ISRG This company was just in a medical device documentary on Netflix that I would put on the same level as Blackfish.

ISRG long-term bullishAccumulation levels are increasing as the Health Care sector shows strength - this should support ISRG's shares long-term

ISRG Detected possible FDA clearance!!!ISRG: intuitive surg inc
2018-07-05 15:36:33
Detected possible FDA clearance


ISRG Swing Idea: Possible upside ~8% upsideMoving Averages: ISRG Recently touched its 50 ma twice, reacting bullishly to the indicator. The 20 Day MA also crossed under price, giving off another short term bullish signal.
MACD: The MACD indicator gave off a bullish signal on February 21st with the trendline crossing the moving average. The price action since then has confirmed the indicator, as the stock is up about 6%.
RSI: RSI (14) is showing increasing buying on the daily chart, after a sell off in December. This is showing that investors are slowly moving back into the stock with RSI rising from ~33 to ~63 where it lies today.
Trendlines: Trendlines are showing a break out from a short term triangle. This breakout is paired with consistent volume giving the stock a positive short term outlook.
Fib Levels:
138%: 475
100%: 450
62%: 424
38%: 408
0%: 381


$ISRG Bullish Ascending Triangle$ISRG Bullish Ascending Triangle - plenty of upside possible within upper channel limits. 535 possible in the medium-term. Monitor for strong break through 471.50 area.


$ISRG Post Earnings Breakout Continuation$ISRG breaking out post earnings. Met resistance at $458 1.27 Fibonacci line, then retraced back down to previous ATH around $450. After bouncing there and then breaking through the previous intraday high of $458, next target is 1.618 line or $476 in the near term. If we can break $476, the upper end of the long term channel will be the final target or ~$500 - possible by early May.

Looks like the Start of an upwards trend!Looking like an upwards trend is starting to develop; MACD just crossed, alligator is opening and moving averages are facing up.


ISRG bullish on hourlyI like this one and you could get in here based on this double bottom breakout or wait until 990.50.


Stock Chart Setup On $ISRG Likely Signals Earnings BeatInvestors should be aware that Intuitive Surgical, Inc. (NASDAQ:ISRG) reports earnings Tuesday, January 24th, 2017, after the stock market closes. After studying the stock chart for some time, it looks like odds favor an earnings beat and upside move. This is seen by viewing the bull-like flag consolidation that is currently underway. It signals accumulation and digestion of the latest up move. The upside is pretty substantial with $720.00 as a target. The current price of Intuitive Surgical is $655.00. Earnings are expected to be $6.21 per shares on revenue of $738 million. Please be aware, IF I decide to take the risk and play this trade, I will most likely limit my risk by grabbing a few call options.
