KMX Reversed From Resistance, Potential Drop!KMX reversed from its resistance where it could potentially fall further to its support.
KMX trade ideas

KMX Approaching Resistance, Potential Reversal!KMX is approaching its resistance where a reversal could occur.


KMX Reversed From Resistance, Potential Drop!KMX reversed from its resistance where we expect to see a further drop to its support.

KMX approaching support, potential bounce! KMX is approaching our first support at 58.15 where we might see a corresponding bounce in price to our first resistance.
Stochastic is approaching support as well.

KMX Bounced Off Its Support, Potential RiseKMX bounced off its support where it could potentially rise to its resistance

KMX Approaching Support, Potential Bounce!KMX is approaching support where a potential bounce to its resistance could occur.

KMX appraoching support, potential bounce! KMX is approaching our first support at 54.37 (horizontal swing low support, 100% fibonacci extension, 61.8% fibonacci retracement) where a strong bounce might occur to our first resistance at 67.25 (horizontal overlap resistance, 50% fibonacci retracement).
Stochastic (89,5,3) is also approaching resistance where we might see a corresponding bounce in price.

KMX Approaching Resistance, Potential Reversal!KMX is approaching resistance where we expect to see a reversal to its support.
Stochastic is also approaching resistance where a corresponding reversal is expected.

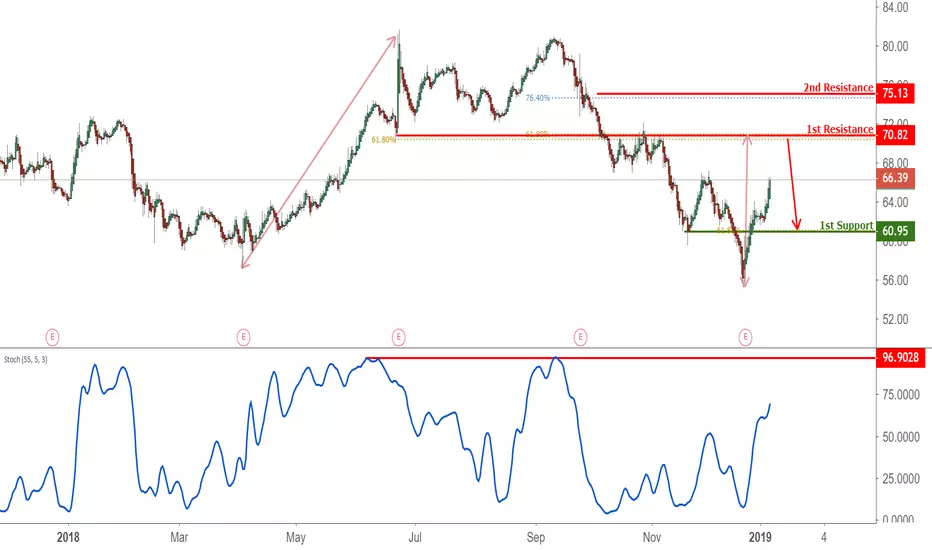
KMX Approaching Support, Potential Bounce!KMX is approaching its support at 59.53 (61.8% Fibonacci extension, 61.8% Fibonacci retracement, horizontal swing low support) where it could potentially bounce to its resistance at 67.10 (61.8% Fibonacci retracement, horizontal overlap resistance).
Stochastic (55, 5, 3) is approaching its support at 3.4% where a corresponding bounce could occur.

KMX Bounce candidateKMX getting to the bottom of a measured move. Will watch this for a short term bounce. Could see a 382 rebound if it catches support.
Probably continue lower after that.

$KMX - Ouch If you like taking candy from a baby - this one's for you. $CRMT earnings this week could put a dent in a new 52 week low - we'll see how the rest of auto-dealerships hold up though. Could get interesting


carmax getting ready for a breakout (4)i think carmax will breakout within 6 months, so get into a good position and enjoy

Dow drops once again #21 (KMX)Technical Concept: Support broken becomes Resistance (Red Arrows= Resistance) (Blue Arrows= Support)
I not use sophisticated technical jargon in an attempt to persuade and impress the reader because I not a charlatan or mountebank person.
I do not use fancy charts plenty of Indicators, Oscillators, Ichimoku Clouds, W.D. Gann Astrology, Bollinger Bands and Fibonacci Retracements.
All in a chart, in an attempt to impress the reader with my knowledge, because I not a Tutor or Mentor.
Who I am? What I do? And what I can do for you?
I am end of day Analyst and stock picker, I support myself in Charts, but I not self-proclaimed Technical Analyst Expert
I use a simple method based in support and resistance, accompanied with moving averages, and I do a Top down Analysis with multiple time frames
My first view of a stock is a 10 year Weekly Chart
Then I do a zoom in and I focus in the action of the last 2 or 4 Years, I look my Daily Chart and 4-Hrs Chart too
I pick stocks manually I watch one by one without the use of a stock screener
I follow approximately 1300 to 1400 Stocks , distributed in 10 industries, with different Market Cap
I do not follow Penny Stocks and Over-The-Counter stocks; I not follow Stocks with an Avg_Volume bellow 100,000 with (Low Liquidity)
I dedicated 10 lonely years of deliberate practice; I open and reset a lot of demo accounts for this purpose.
I tried and practice with different Markets (Forex, Options and Stocks) with different Time Frames (Intraday, Scalping, Swing/Position)
I tried Mechanical Trading too, but definitely I am Discretionary Analyst or Qualitative, It took me years to know it, and a lot of books,
!Even about Accounting¡ I've learned by myself, but I do not think I'm smarter than others, "Ego is a Sin"
I understand the art of Short Selling and enjoy the search of this kind of patterns.
What I can do for you?
I can put ideas in the desk of Professional Traders, the ideas are based in Price Patterns+Price Action, they can trade with your own system or set up
My ideas are not influenced by my emotions, the media, or my neighbors.
I have no preference for a particular industry I follow 10 Industries even Public Utilities. I only focus in Price Patterns+Price Action
This was my Resume and Cover letter
Sincerely
Alex_Quiroga

nested head and shoulders on KMXHere is what I think is happening.
KMX is in a nested H&S pattern, currently undergoing the engulfing H&S
1. Its currently in short term over bought, though I believe there is a little bit more for the price to move up. I could be wrong and the 63.00 price is the resistance that it has hit and continue the down trend .
2. the stock seems to stick to previous trend lines reasonably well and from the looks of it the price may reach the first trend line resistance at 64.00. If the volume action over the preceding few days starts to drop till it reaches 64 with very high Over bought Indication, the stock could start to tank, as 64 is lower than the last 2 lows of the engulfed H&S pattern.
3. If the price starts going south, it is likely that the stock would reach the 2016 support trend line or a very strong support trend line since 2007.
4. now if the volume action remains strong and blows past 64 and reaches 65.8 as top of the shoulder, it is highly likely that the engulfing H&S pattern is going to be invalid, the stock could take immediate support and may remain bullish. but if the volume action was poor in getting to 65.8, it would be worth a wait to see what the stock would do if it does start a bearish trend .
- cheers
Scorp


