LIRemains holding support on long term channel breakout. Considlation is happening this looks beautiful as long as we takin above 36$. 40.50 is big resiatnce for this current channel
LIA/N trade ideas

LI ready for the next leg? Li Auto
Short Term
We look to Buy at 36.56 (stop at 34.78)
We look to buy dips. The medium term bias remains bullish. Downward pressure has continued and we are assessed as being in the corrective leg lower before the next rally. The bias is still for higher levels and we look for any dips to be limited. Expect trading to remain mixed and volatile.
Our profit targets will be 41.22 and 44.10
Resistance: 42.00 / 50.00 / 60.00
Support: 37.00 / 32.60 / 25.50
Disclaimer – Saxo Bank Group. Please be reminded – you alone are responsible for your trading – both gains and losses. There is a very high degree of risk involved in trading. The technical analysis, like any and all indicators, strategies, columns, articles and other features accessible on/though this site (including those from Signal Centre) are for informational purposes only and should not be construed as investment advice by you. Such technical analysis are believed to be obtained from sources believed to be reliable, but not warrant their respective completeness or accuracy, or warrant any results from the use of the information. Your use of the technical analysis, as would also your use of any and all mentioned indicators, strategies, columns, articles and all other features, is entirely at your own risk and it is your sole responsibility to evaluate the accuracy, completeness and usefulness (including suitability) of the information. You should assess the risk of any trade with your financial adviser and make your own independent decision(s) regarding any tradable products which may be the subject matter of the technical analysis or any of the said indicators, strategies, columns, articles and all other features.
Please also be reminded that if despite the above, any of the said technical analysis (or any of the said indicators, strategies, columns, articles and other features accessible on/through this site) is found to be advisory or a recommendation; and not merely informational in nature, the same is in any event provided with the intention of being for general circulation and availability only. As such it is not intended to and does not form part of any offer or recommendation directed at you specifically, or have any regard to the investment objectives, financial situation or needs of yourself or any other specific person. Before committing to a trade or investment therefore, please seek advice from a financial or other professional adviser regarding the suitability of the product for you and (where available) read the relevant product offer/description documents, including the risk disclosures. If you do not wish to seek such financial advice, please still exercise your mind and consider carefully whether the product is suitable for you because you alone remain responsible for your trading – both gains and losses.

$LI High Tight Flag #PowerPlay$LI put in its 9 day in its High Tight Flag #Powerplay setup. Still a bit short but the min 9 to 10 days I look for has now been met.
Correcting only 12% after its 120% advance = Power.
Focus for next week.

$LI potential high tight flag forming$LI has gained over 100% in 7 weeks and now flagging with a max correction value of 13%, making it a key contender for a high tight flag set up. Wait for price to break to close over the top of the flag pole, with volume, before jumping in - ideally, look for a close over $41.59

LI - Overshoot ShortLI has hit my potential SRZ Shakeout Reversal Zone for the overshoot ratios of two 3 pivot Fibonacci extensions (yellow and white trendlines).
This time i've just drawn a blue band without the fibs for a clean chart, but these show the 2 doundaries of the overshoot ratios.
LI has topped a few times in this area and so there will be heavy resistance from sellers and shorts here.
In addition there are 5 BIG gaps in this uptrend and it looks very unstable.
I am staggering into a short here and will hold till the gaps fill.
I will add more if/when i see a bearish candle with upper wick.
Not advice.

$LI Breakout #stocks#LI Breakout 🚀 in 1h Chart and - Target 46$ 🧲
All Entry Criteria have been met:
1. Price above 10, 20 & 50 EMA ✅
2. Consolidation Phase in Uptrend ✅
3. Breakout on above average Volume ✅
4. Breakout Suoertrend line ✅

SHORT Li NASDAQ:LI
Near all time High
The upside gas is running out, waiting for correction.
Gaps to downsides,Volume increasing.
Hanging man candle, Waiting to confirmation.
Will update in the idea entry, tp , sl.

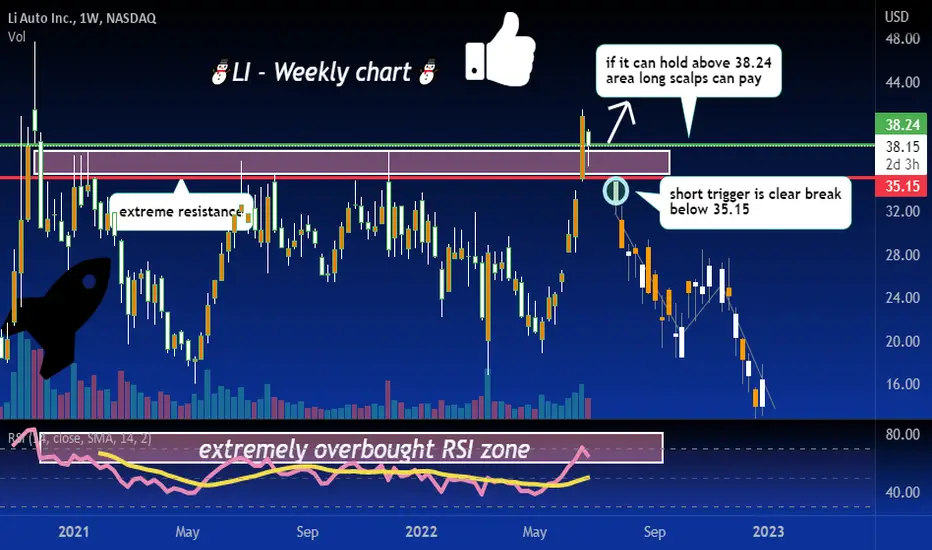
LI very overbought now 😜even though its so overbought I think long scalps can pay above 38.24, watching for puts below 35.15
Li Auto goes from strength to strength. Here’s why! Li Auto is up a staggering 71% over the past month as the Chinese EV manufacturers continue to make gains despite Covid-19-induced disruption.
Li Auto (NASDAQ:LI) also known as Li Xiang, is a Chinese electric vehicle manufacturer headquartered in Beijing, with manufacturing facilities in Changzhou. The company’s share price dipped along with other growth stocks at the beginning of the year, but it’s now trading at an all-time high.
What was holding the Li Auto share price back?
Li, like its Chinese peers, saw its share price fall from over 140 HKD at the end of last year, to less than 70 HKD in March. Investors lost confidence in the company’s ability to continue delivering growth as China enacted a swift response to small outbreaks of Covid-19. Both commerce-centre Shanghai and capital, Beijing, were hit by new restrictions to prevent the spread of the virus.
Li Auto delivered 31,716 Li ONEs in Q1, representing a 152.1% year-over-year increase. This was consistent with the company's previous forecast of 30,000-32,000. However, due to Covid-19-induced lockdowns and disruption, deliveries for April 2022 fell. Only 4,176 Li ONEs were delivered in April, representing the lowest volume in recent months, and contributing to a negative year-over-year growth rate. Production recovered in May, with 11,496 Li ONEs delivered. The company lowered its guidance to 21,000-24,000 for the second quarter, although it seems likely that Li Auto will surpass that. The company was also forced to increase the price for its vehicles amid rising battery prices.
Production issues were felt across China’s manufacturing sector. Peer NIO (NASDAQ:NIO) even postponed the launch of a new vehicle amid suspended operations and a fall in sales.
Why has the Li Auto share price gained?
Li Auto’s gains over the past month are pretty outstanding. The stock is now trading for other 150 HKD. So, how did this happen?
Investors’ fears that Chinese manufacturing would be hampered for the foreseeable future have been alleviated. Despite new restrictions, Beijing appears to have taken a more business-friendly approach to managing Covid-19. 96.3% of industrial businesses in Shanghai have resumed operations, according to a recent update China's Ministry of Industry and Information Technology.
In early June, Li Auto said that, although its parts suppliers have resumed production, its own manufacturing facility wasn’t running at full capacity. However, May’s production data suggest that the firm is operating much closer to full capacity that it had done in April.
There has been more positive news for Li Auto too. The group saw strong trading volume on this week after Citigroup raised their price target on the stock from US$26.8 to US$58.6. Other brokers, including Barclays have recently backed the EV maker too.
Li Auto also unveiled its L9 model earlier this week. It was well-received, and investors will be glad to see the firm diversifying its offering. The EV will sell for 459,800 yuan (US$68,654) and Li Auto has already started taking orders. The group is targeting production of 10,000 units per month.
The L9 is Li Auto’s second model since its inception seven years ago. The L9, with an extended battery range, will be able to go as far as 1,315km on a single charge, according to the Beijing headquartered firm. “This is a full-size SUV with no match on the market,” Li Xiang, Li Auto’s co-founder and CEO, told a virtual launch event.

$LI Breakout Target 37.5$ #Trading$LI Breakout in 1h Chart on above average volume after consolidation phase - Target 37.5$
All Entry Criteria have been met:
1. Price above 10, 20 & 50 EMA --> Check
2. Consolidation Phase in Uptrend --> Check
3. Breakout on above average Volume --> Check

Doji Central on Li Li Auto
Short Term - We look to Sell at 23.77 (stop at 25.22)
Preferred trade is to sell into rallies. The medium term bias remains bearish. Price action has posted a Doji candle and signals a possible reversal of the recent trend. The bias is still for lower levels and we look for any gains to be limited. Expect trading to remain mixed and volatile.
Our profit targets will be 19.01 and 16.22
Resistance: 24.00 / 30.00 / 35.00
Support: 20.00 / 17.00 / 15.00
Disclaimer – Saxo Bank Group. Please be reminded – you alone are responsible for your trading – both gains and losses. There is a very high degree of risk involved in trading. The technical analysis, like any and all indicators, strategies, columns, articles and other features accessible on/though this site (including those from Signal Centre) are for informational purposes only and should not be construed as investment advice by you. Such technical analysis are believed to be obtained from sources believed to be reliable, but not warrant their respective completeness or accuracy, or warrant any results from the use of the information. Your use of the technical analysis, as would also your use of any and all mentioned indicators, strategies, columns, articles and all other features, is entirely at your own risk and it is your sole responsibility to evaluate the accuracy, completeness and usefulness (including suitability) of the information. You should assess the risk of any trade with your financial adviser and make your own independent decision(s) regarding any tradable products which may be the subject matter of the technical analysis or any of the said indicators, strategies, columns, articles and all other features.
Please also be reminded that if despite the above, any of the said technical analysis (or any of the said indicators, strategies, columns, articles and other features accessible on/through this site) is found to be advisory or a recommendation; and not merely informational in nature, the same is in any event provided with the intention of being for general circulation and availability only. As such it is not intended to and does not form part of any offer or recommendation directed at you specifically, or have any regard to the investment objectives, financial situation or needs of yourself or any other specific person. Before committing to a trade or investment therefore, please seek advice from a financial or other professional adviser regarding the suitability of the product for you and (where available) read the relevant product offer/description documents, including the risk disclosures. If you do not wish to seek such financial advice, please still exercise your mind and consider carefully whether the product is suitable for you because you alone remain responsible for your trading – both gains and losses.

Li Auto: Scope to move lower? Li Auto
Short Term - We look to Sell at 22.46 (stop at 24.15)
Preferred trade is to sell into rallies. The medium term bias remains bearish. The trend of lower highs is located at 29.60. The bias is still for lower levels and we look for any gains to be limited.
Our profit targets will be 16.90 and 16.22
Resistance: 22.50 / 25.00 / 30.00
Support: 100.00 / 17.00 / 15.00
Disclaimer – Saxo Bank Group. Please be reminded – you alone are responsible for your trading – both gains and losses. There is a very high degree of risk involved in trading. The technical analysis, like any and all indicators, strategies, columns, articles and other features accessible on/though this site (including those from Signal Centre) are for informational purposes only and should not be construed as investment advice by you. Such technical analysis are believed to be obtained from sources believed to be reliable, but not warrant their respective completeness or accuracy, or warrant any results from the use of the information. Your use of the technical analysis, as would also your use of any and all mentioned indicators, strategies, columns, articles and all other features, is entirely at your own risk and it is your sole responsibility to evaluate the accuracy, completeness and usefulness (including suitability) of the information. You should assess the risk of any trade with your financial adviser and make your own independent decision(s) regarding any tradable products which may be the subject matter of the technical analysis or any of the said indicators, strategies, columns, articles and all other features.
Please also be reminded that if despite the above, any of the said technical analysis (or any of the said indicators, strategies, columns, articles and other features accessible on/through this site) is found to be advisory or a recommendation; and not merely informational in nature, the same is in any event provided with the intention of being for general circulation and availability only. As such it is not intended to and does not form part of any offer or recommendation directed at you specifically, or have any regard to the investment objectives, financial situation or needs of yourself or any other specific person. Before committing to a trade or investment therefore, please seek advice from a financial or other professional adviser regarding the suitability of the product for you and (where available) read the relevant product offer/description documents, including the risk disclosures. If you do not wish to seek such financial advice, please still exercise your mind and consider carefully whether the product is suitable for you because you alone remain responsible for your trading – both gains and losses.

LI AUTOPrice still inside the yellow channel ,
(16.75$ -18$) is a good buying zone
We’re targeting : 25$ in the next 5 month
In general Li is one of the best electric car in china , having a great numbers ,
company for future
@REVENUE_JO


Li Auto Triple top breakout or breakdownAre Chinese stocks going to be devalued to oblivion or should we be snapping them up on the lows?

Li Support Breaking?Li Auto - Short Term - We look to Sell a break of 26.98 (stop at 28.34)
Trading within the Channel formation. The bias is still for lower levels and we look for any gains to be limited. Previous support located at 28.00. A break of 28.00 is needed to confirm follow through negative momentum. Risk/Reward would be poor to call a sell from current levels.
Our profit targets will be 22.54 and 21.60
Resistance: 29.00 / 33.00 / 35.00
Support: 28.00 / 25.00 / 20.00
Disclaimer – Saxo Bank Group. Please be reminded – you alone are responsible for your trading – both gains and losses. There is a very high degree of risk involved in trading. The technical analysis, like any and all indicators, strategies, columns, articles and other features accessible on/though this site (including those from Signal Centre) are for informational purposes only and should not be construed as investment advice by you. Such technical analysis are believed to be obtained from sources believed to be reliable, but not warrant their respective completeness or accuracy, or warrant any results from the use of the information. Your use of the technical analysis, as would also your use of any and all mentioned indicators, strategies, columns, articles and all other features, is entirely at your own risk and it is your sole responsibility to evaluate the accuracy, completeness and usefulness (including suitability) of the information. You should assess the risk of any trade with your financial adviser and make your own independent decision(s) regarding any tradable products which may be the subject matter of the technical analysis or any of the said indicators, strategies, columns, articles and all other features.
Please also be reminded that if despite the above, any of the said technical analysis (or any of the said indicators, strategies, columns, articles and other features accessible on/through this site) is found to be advisory or a recommendation; and not merely informational in nature, the same is in any event provided with the intention of being for general circulation and availability only. As such it is not intended to and does not form part of any offer or recommendation directed at you specifically, or have any regard to the investment objectives, financial situation or needs of yourself or any other specific person. Before committing to a trade or investment therefore, please seek advice from a financial or other professional adviser regarding the suitability of the product for you and (where available) read the relevant product offer/description documents, including the risk disclosures. If you do not wish to seek such financial advice, please still exercise your mind and consider carefully whether the product is suitable for you because you alone remain responsible for your trading – both gains and losses.

Li-long position I been accumulating li since $20.
Li is exhibiting a decrease in volatility and in volume.

LI small long positionElliott Wave count I’m following:
White = I’m doing a larger degree ABC count
--> Target upside is $58 longer term
Green = Looks like coming off wave (ii) retrace around $27.73. Green count is within White C.
--> Target upside $40; $50
Light Blue = smaller degree count within green wave (iii). Counting that we put in light blue wave “i” and wave “ii” and we are potentially starting a blue wave "iii". This would align with EW theory that wave 3's are most powerful, indicating the strong move potential to get up and over the red down trend resistance line.
--> Target upside $38 for light blue “iii”; potential $45+ for longer term light blue “v”
I’m just in a small, long call spread weeks out. The yellow dotted line represents potential EW count invalidation for light blue below $29. Below $27.73 could be considered as overall invalidation and price movement creating overall different structure

#LI price action is trapped in a range#LI price action is trapped in a range at the end of this range I am starting to see some bearish momentum we could see price action break the bottom of this range and continue to the downside.
NASDAQ:LI

LI: More Pain?It looks like there's more pain on the way come in for LI considering a key Gann angle has been breached and support was also broken. Keeping an eye on this one - Could be a good short opportunity

Li Auto-bullish movementLi Auto bounced really hard back in May, just published Q3 results today, which was better than expected. This could help Li to move up more, first target would be $36.5. On the downside we have support at the trend line and in the $30-$32 dollar zone.
Not financial advice, just my opinion.
Stay green. :)

$LI Still on the watch listI'm still watching $LI
Maybe something like this heading into earning would be ideal.
Nice 5 months base so remains on the watchlist
Quick TradeLooking for a fake bullish cross.
Short position with stop at $31.3 / $31.4.
The entry depends on what will happen with the next candles.
