PTON H&S pattern on WeeklyPTON Completed Head and Shoulder pattern on Weekly. It has completed a pullback.
I will be watching for price action on the hourly chart and looking for the short entry
PTON trade ideas

Further Downside for PTON?We are now around a 50% retracement level from the previous impulsive move down and coinciding with the overall trendline. Watch for bearish candles on the LTFs for possible short opportunities.

$PTON Trade Idea$PTON TRADE IDEA
Entry: 100
Strike: 5/28 102c
Targets: 105, 109, 113
Support: 93, 88, 83.50
@KyleTrades86 @TradingView

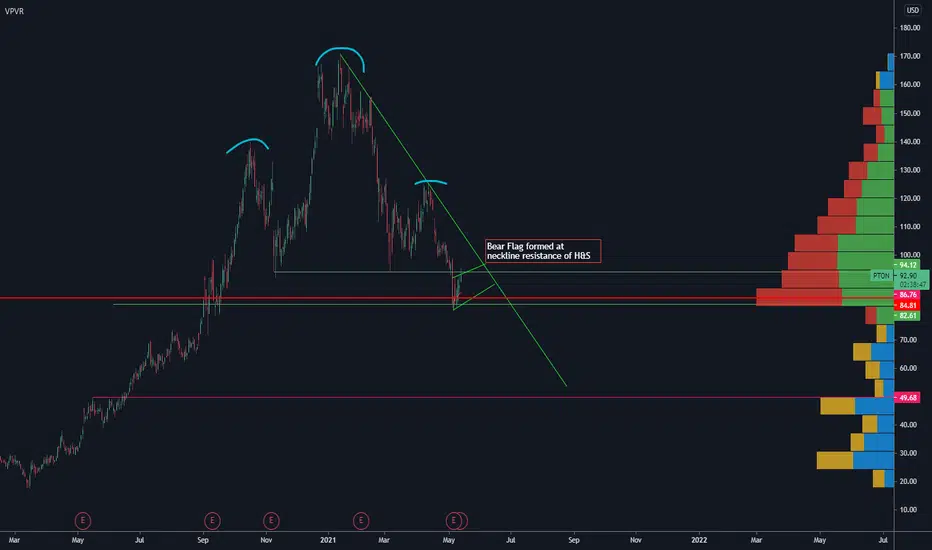
PTON - Shorting the fancy hamster wheel for quarantined momsPTON has had a tremendous run over the past few months going from approximately 30 dollars to above 160. Over a 500% move. Makes you question how much its really worth doesn't it. Well we are about to get the answer soon. PTON has formed a head and shoulders that has taken 5 MONTHS to form. On May 5th we had our breakdown with VERY HIGH VOLUME where PTON broke through its 100 support, which acted as support for 5 MONTHS. Right now PTON looks like it is going to retest the previous 100 support level. My opinion, when it gets there the 100 level will become a resistance. PTON will then continue on its bearish move to its next highest VPVR region of 70 to 60 dollars. That is almost a 25 to 35 dollar move from where we are currently. If things get really hairy then we are going down to the next VPVR level, which is where I think we will end up at the end of all this, the 45 dollar level. A 50 dollar drop from where we are as of this post (95.19).
There are two very important things to consider here...
1) The amount of time it took for the pattern to form
Patterns are stronger on higher time frames. A head and shoulders on the daily that has taken 30 days to form will be stronger than one that has taken 10 days to form. This pattern is on the daily and has taken 5 months (5
MONTHS!!!!) to form. I cannot stress how important the length of time frame is. A head and shoulders is thought to be a very bearish pattern, combined with the long time frame gives the bear thesis for PTON lots of strength.
2) Breakdown of support with HIGH volume
Breakout trading requires breaks at specific price levels accompanied with high volume. Here we have a breakout to the downside at the support level of 100 with extremely high volume. By extremely high volume I mean
almost 3 to 4 times the average volume on the daily.
3) The end of quarantine (OPINION)
I don't know about you but I'd rather be outside on a bike than inside. Although I still don't know how to read through the fundamentals, the end of quarantine will for sure bring an end to the work out from home craze. Bringing
the sentiment of PTON down. Most people love going to gyms to be around other who are working out or going outside and enjoying nature. With less restrictions coming in the upcoming months, I highly doubt people will want
to be peddling and looking at nature through a small screen and would rather be peddling outside.
Combining all of these aspects has led me to the bear thesis for PTON.
Happy Trading!
"The hard work in trading comes in the preparation. The actual process of trading, however, should be effortless" - Jack Schwager

Peloton ready for limboCan't get over that H&S neckline (Yellow line).. Last 10 day build up I highlighted in green is looking like a bear flag. Targets are red lines (Fib). stop loss at 99

Please welcome the Bear Flag to the PTON chart!If you have been watching the PTON chart for the past few weeks and/or been following my ideas over the past two weeks, you would have seen the head and shoulders pattern materialize/activate. However, earlier this morning, a new pattern entered the mix! As you may already know, it is very common for the price to come back up to the neckline of the H&S pattern after breaking below, so there was no reason for people with short positions in PTON to panic when seeing the price rise rapidly over the last week. The twist here is that not only is the Head and Shoulders pattern still valid, but there is now also a valid bear flag in play! This bear flag was a few days in the making and was confirmed earlier today. The reversal pattern (H&S) initiated the downtrend by reversing the uptrend and the continuation pattern (Bear Flag) along with the active H&S pattern will most likely pull the price down:
Price Target 1: ~$70
Price Target 2: ~$55
If/when the price can hit the first target, we can hope for the price to go lower and hit the second target. Please view my last three ideas for reference of the Head and Shoulders pattern. I will keep this idea updated with any updates to my stance on this.

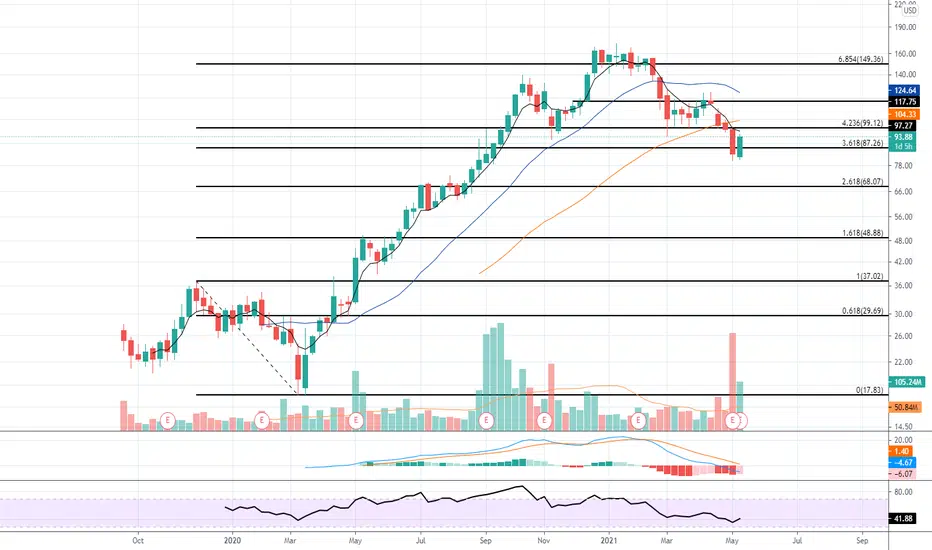
$PTON no buying signal yet$PTON is retracing the big 10x move from 2020, and 50% pullback has already been reached.
Nevertheless, I don´t see a trade unless both the black trendline AND mid 90s resistance are broken.
From my point of view, a test of 61,8% retracement (@ 76.58) would give us even more value to be captured.

Is PTON really bearish short term?Some people is ignoring the divergence on MACD on daily chart.
And we all know PTON is retesting the neckline and some people is thinking it will drop again after that.
However, if you spend some time and thinking about the price actions, you might find something different.
1. The volume.
Volume is increasing obviously. And checking 15 mins chart, PTON price is already above the BAR which had the highest Volume in Day May 05.
2. Price Bar.
Close Price does not drop below the low point of Bar in May 05 and try to break the upper line instead.
3. Did not drop when NASDAQ drops in past few days
What does this mean?
1. some big players are taking shares whoever sells it.
2. shorter covers their sales? Maybe.
3. people who short PTON on May 05 is bearing a loss. Short squeeze!
If PTON price goes above the neckline, then it's a fake fall which is bullish from mid-long term.
My personal bias for PTON is bullish.
However, only market can tell truth, so if price goes below 80, PTON is very bearish
This will be confirmed in following days

Peloton shares forecast for 2021Peloton is the largest interactive fitness platform in the world. The company generates revenue by selling innovative exercise equipment and subscribing to various classes and workouts. Sales have surged over the past three quarters, with fitness enthusiasts unable to attend gyms and forced to work out at home.
Over the past year, Peloton has taken several steps to solidify its status as a fitness industry leader. Several new products were introduced, including treadmills and cheaper models of exercise bikes. The company has signed a deal with artist Beyonce to create exclusive music for its platform. It also acquired the commercial company Precor, which is also engaged in the production of exercise equipment. And more recently, Peloton management announced that the company will start selling its products in Australia, and an active partnership with Adidas begins.
From a technical point of view, the price of Peloton shares in 2020 has increased significantly from the level of 17 to 170 dollars per share. However, now the quotes are being corrected and fell below the $100 level. In November last year, the price also fell below $95, but quite quickly the stock continued to rise. The current decline also looks like a good signal to enter the market. The nearest target for a rebound from an important support is the $140 level. And after the breakout of the $170 level by buyers, you can send the price above the $245 level. An aggressive deal is a purchase already at the current levels with a close stop below $90. If we consider the conservative option, then we should wait for the breakdown of the $120 level, this will indicate the completion of the formation of the "Double Bottom" reversal model in order to work out the pattern at the $143 level.


PTONI have a head & shoulders breakdown target of around the 0.618 retracement on this chart ($30ish). Bulls better pray that neckline break reverses quickly or it's a long way down from here.


1hr bearish analysisPeleton has been downtrending due to market conditions and the huge recall and lawsuit they are facing.
Overall I am bullish longterm but think we will see a continued downtrend to list key support levels
Happy trading
Never financial advice

A Look at Peloton(This is not financial advice)
Just a quick look at PTON not quite bullish because of negative sentiments in the media. Long term this is a great stock and will in my opinion do well in the future with such a strong business model with it's memberships. Did some quick TA here as well if you were to make a play this is what I would keep in mind.
Thanks!
- Vlaire


Head and shoulders pattern for PTONPTON I think will retest the neck line before going down further. short opportunity

