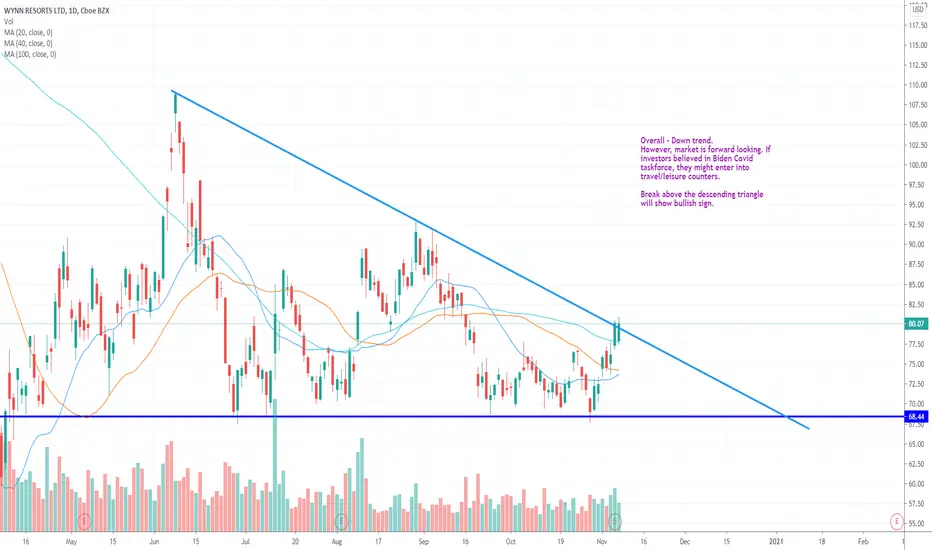
If break and closed above the triangle, looking to long.Overall - Down trend.
However, market is forward looking. If investors believed in Biden Covid taskforce, they might enter into travel/leisure counters.
Break above the descending triangle will show bullish sign.
WYNN trade ideas
Double BottomWYNN has been a bottom dweller for quite a while, just floundering around and not moving too far up or too far down
Possible T2 100.2 109
NV has increased
Not a recommendation


Range bound WYNNBuy at the green arrows and sell at the red ones. Your odds are good it's too easy, better than the slot machines for sure!

WYNN LONG SPIKE SETUPAs long as WYNN holds over the support line it has been sitting on I expect I spike up to the levels of the pink bubbles

WYNN BreakdownWYNN has consistently tested the 70 level which has acted as significant support. It keeps coming back to that level almost wanting to break beneath it. The buying and demand over 70 is running dry and i believe this will break below in the next couple days. When it does it will have downward momentum due to the strength of that support. I suspect this can break below to the 60-63 range.

BUY WYNNWYNN extremely good setup with a high RR
85 has a very good chance of being hit on a breakout to the upside
$85 calls are very cheap, especially for OCT 23 - Going for .06 and IF WYNN can make this breakout move as it has done multiple times in the past, these could be ITM and go for well over 1.5

$WYNN 4 Month #DescendingTriangleThis casino stock looks vulnerable to starting another leg lower potentially all the way back to Covid19 lows. The stock is forming a 4 month descending triangle chart pattern with $68.50 level tested multiple times. A clear daily close below that level will complete the pattern and should push the stock lower. 1st target $50 round number.

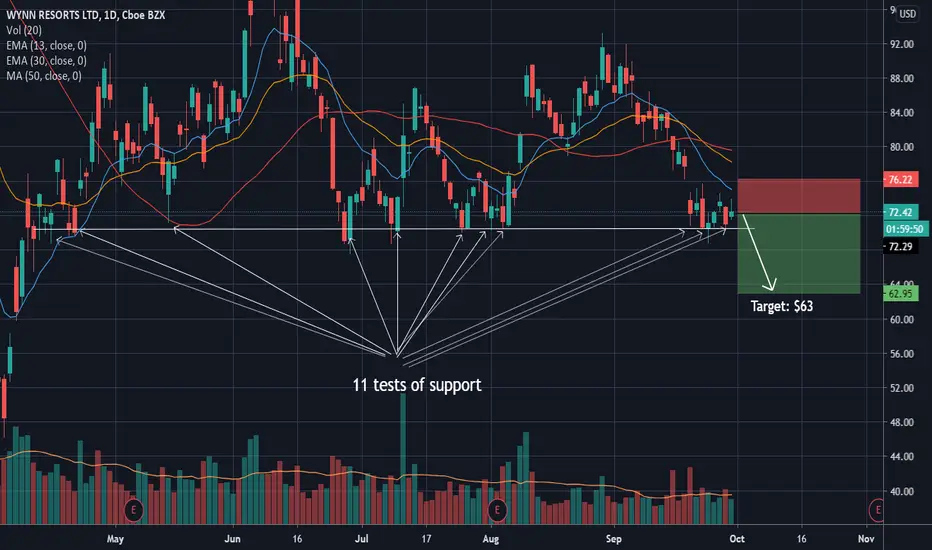
WYNN Breakdown after 11 testsWYNN has tested the support at the $70 mark 11 times. With each test of support makes that range weaker with more supply being taken out. I'm looking for a breakdown to finally take place here and when it does i suspect it'll be high volume to the downside do to the amount of times support was tested.
WYNN Long, at sideways bottomIdentify Price action:
1. Sideways;
2. Aggressive move;
3. Sudden Reversal;
Current price is at bottom of sideway range.
Entry 73
Stop 67
Target1 90; reward:risk=2.5:1
Target2 106; reward:risk=5:1
I am not a PRO trader. I need few months to practice trading strategies.
If you like this idea, please use SIM/Demo account to try it, until my trading plans get high winning rate.


WYNNHead & shoulders with neckline around $69 is another way to look at it. Price target from this breakdown puts it right around the prior low (few $ under).

WYNNUnless we get a hard reversal this week, this probably goes for a retest of the lows if I had to guess.


WYNN - 25.41% Potential Profit - Corridor BreakoutCorridor Breakout graduating from a 2-month correction period. Note that vaccine-related news might make or break this trade, this is why I keep the stop loss fairly tight. However, I feel positive given today's news and the upside could be massive.
Target price set at a new potential resistance line.
- 3-month uptrend followed by a 2 month correction period that might be over amid positive vaccine news
- RSI + Stoch well above 50
- MACD above Signal.
Suggested Entry $86.84
Suggested Stop Loss $84.59
Target price $110.86
Note that I tend to adjust stop losses in order to secure profits early and preserve capital. This means that the target price is going to be achieved as long as there are no strong pullbacks that trigger my new adjusted stop loss.


Go Long, Wynn Resorts Inverse head and shoulders chart patternSame chart pattern as Las Vegas Sands.
Inverse head and shoulders chart pattern, rsi , cmf and macd are all looking good.
Breakout coming soon?


WYNN Gap Fill ReversalWYNN has a gap in its chart that recently has been 100% filled. Expecting for a reversal back up to resistance at the $85 range. All the moving averages are basing underneath price to help push it upward.

WYNN - First Bearish Trend to $77 and after that either 69 or 86WYNN - First Bearish Trend to $77 and after that either 69 or 86 in short term.


