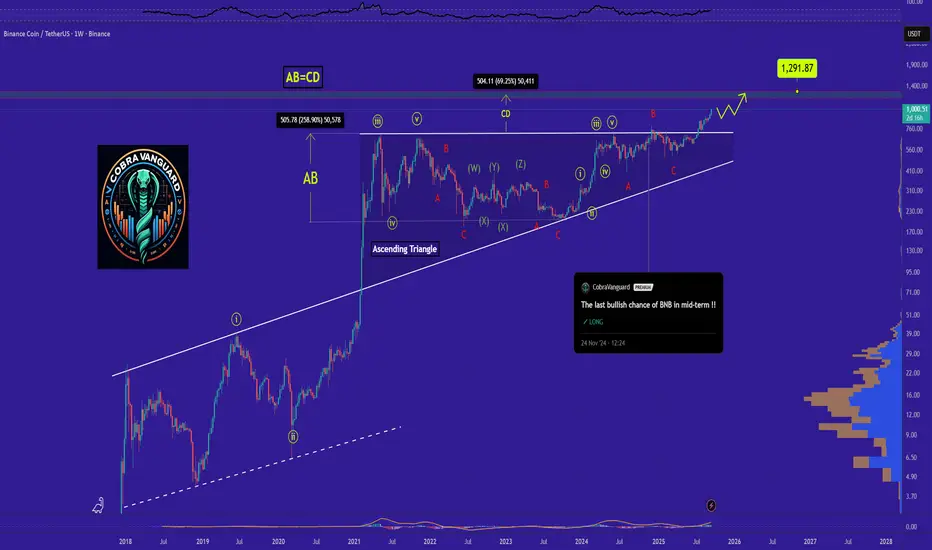
BNB/USDT | BNB Bull Run Continues – No Signs of Correction Yet!By analyzing the Binance Coin (BNB) chart on the weekly (logarithmic) timeframe, we can see that the price has set a new ATH above $1,000. Since the last time I analyzed BNB — over 2 years ago — the price has increased by more than 400%!
Currently, BNB is trading around $1,060, and there are still no signs of a correction on the chart. With the current momentum, I expect further growth, possibly pushing the price to levels above $1,200. This analysis will be updated again!
Please support me with your likes and comments to motivate me to share more analysis with you and share your opinion about the possible trend of this chart with me !
Best Regards , Arman Shaban
BNBUSDT.3S trade ideas

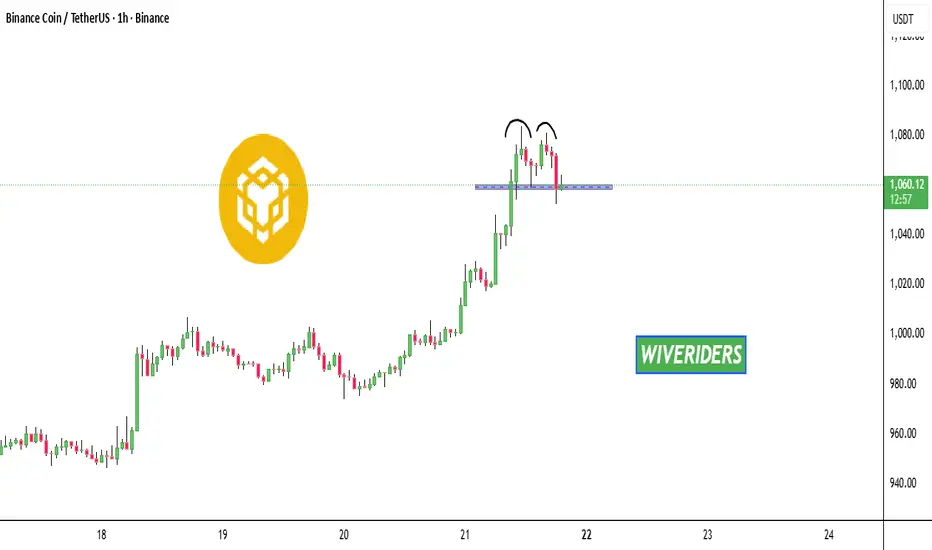
What do you think about $BNB hereWould you want to sell here? I just feel BNB will sell very soon, maybe after the FOMC news update later today.
What do you think?

BNB is bullish now and many Traders don't see it !!As I said, BNB broke the triangle, it reached to $1000 , and you still think I'm joking!!
The price is currently supported well, which can increase the price.
Stay Awesome , CobraVanguard
previuos analysis
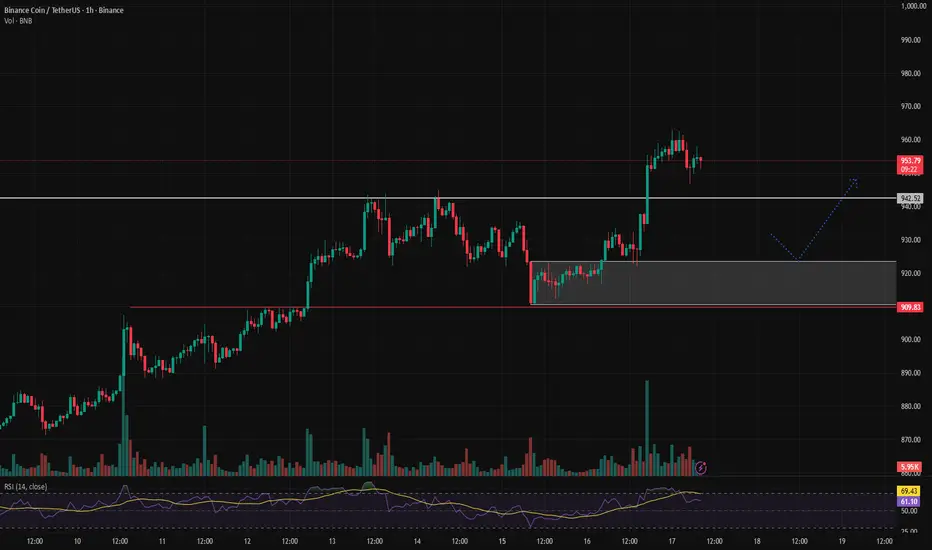
BNBUSDT Technical Analysis (1H Timeframe)Let’s see what opportunities the market might give us to enter! 🚀
BNB price recently broke above the 942 resistance level and rallied sharply to around 955.
It is now undergoing a minor pullback. Based on the current market structure, a potential scenario is a retracement toward the 915–925 demand zone , where buyers may step in again and push the price back up above 942 .
🔹 Key Support Zone: 915 – 925
🔹 Key Short-Term Resistance: 942 – 945
🔹 Likely Scenario: Pullback to demand zone followed by a bullish continuation
BNB remains extremely bullish and can hit $1400 soonBNB continues to hold a strong bullish structure on the 4H chart, staying above the 50 EMA and maintaining higher highs and higher lows. Momentum indicators remain supportive of the trend.
📌 Plan: Look to buy the dips.
First demand zone: $959 – $975 (Fib 0.618 support + previous structure)
Second demand zone: $939 – $950 (deeper retracement area)
🎯 Upside targets:
$1,050 → short-term extension
$1,280 → continuation
$1,400 → major bullish target

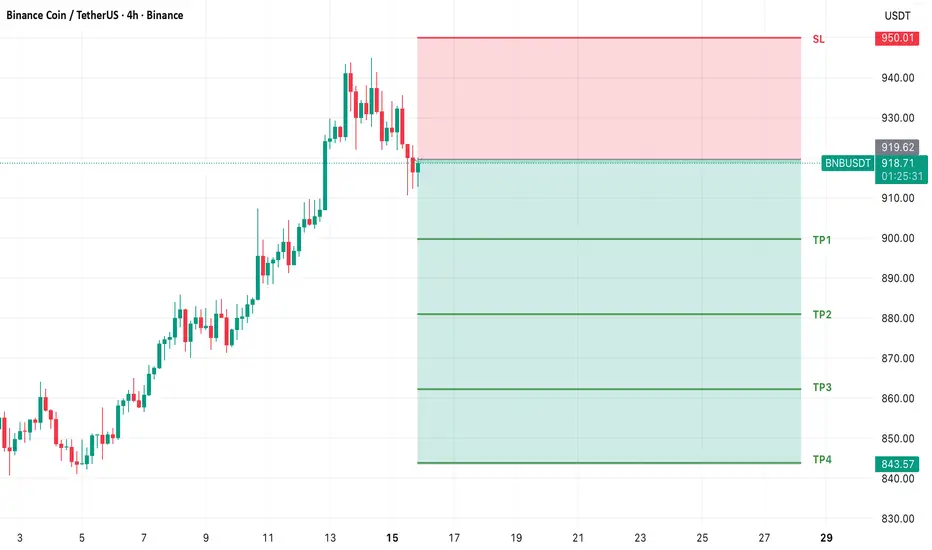
BNB SHORT TRADE SETUPNew Trade Setup: BNB-USDT
SHORT
Entry: 918.52 or CMP
Target: TP1: 899.78, TP2: 881.04, TP3: 862.30, TP4: 843.57
Stoploss: 950.01
Leverage: 1X
Technical Analysis: BNB/USDT is taking reversal at its resistance zone, indicating a high chance of a short-term trend reversal. We may see an downtrend in the short term.
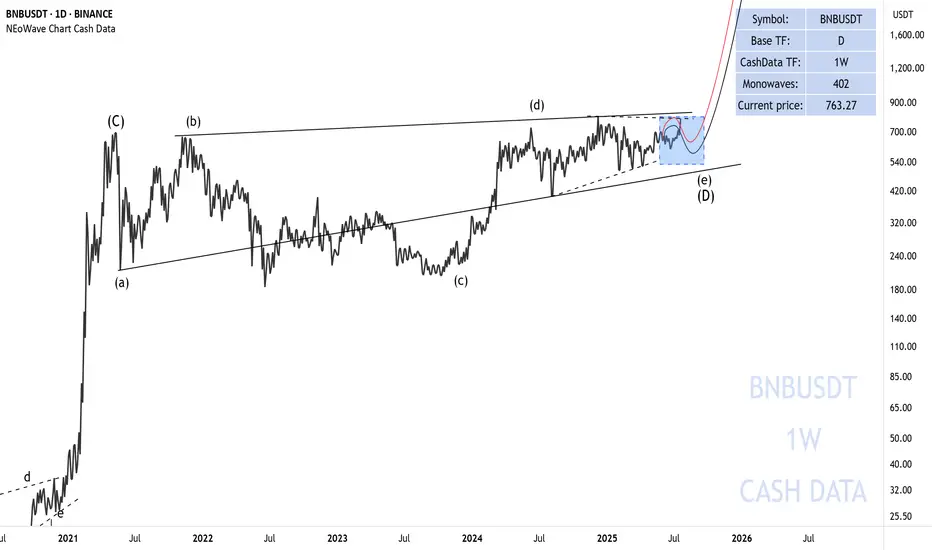
BNB is getting ready to riseThe first bullish move I was expecting for BNB has taken place and it looks like we should be waiting for the formation of wave-e of (e).
After the completion of wave-(e), we expect a big rise for BNB.
Good luck
NEoWave Chart
BNB Targets $1100–$1200 After Reclaiming All-Time HighsBNB has decisively reclaimed its all-time highs, reinforcing its strong bullish market structure. Technical projections suggest the next Fibonacci extension lies between $1100 and $1200, offering the next clear target zone.
Among major altcoins, BNB has shown one of the most impressive structural recoveries, reclaiming its all-time highs and maintaining strong momentum. The weekly chart highlights a bullish projection with higher targets still to come, supported by Fibonacci extension confluence. Traders now anticipate whether BNB can maintain its trajectory toward the $1100–$1200 zone.
Key Technical Points:
Reclaimed all-time highs, confirming bullish continuation.
Strong weekly trend structure supports further gains.
Next 0.618 Fibonacci extension sits at $1100–$1200.
BNB’s strength lies in its ability to overcome major resistance at previous highs. This reclaim often signals renewed momentum, opening the path to new price discovery zones. Current price action remains bullish across higher timeframes, with no signs of structural weakness.
The 0.618 Fibonacci extension of the current move projects a range between $1100 and $1200. This makes the zone a logical magnet for price action as traders seek new targets. Given the bullish demand observed in the order books and strong participation on the weekly chart, continuation higher remains the dominant bias.
However, traders should remain cautious of corrective pullbacks. Any sharp retests of reclaimed support levels should be viewed in the context of continuation, provided the overall structure of higher lows remains intact.
What to Expect in the Coming Price Action:
BNB’s technicals point toward higher prices in the immediate short term, with the $1100–$1200 zone standing as the next major target. Corrections may occur, but the broader weekly structure remains firmly bullish.

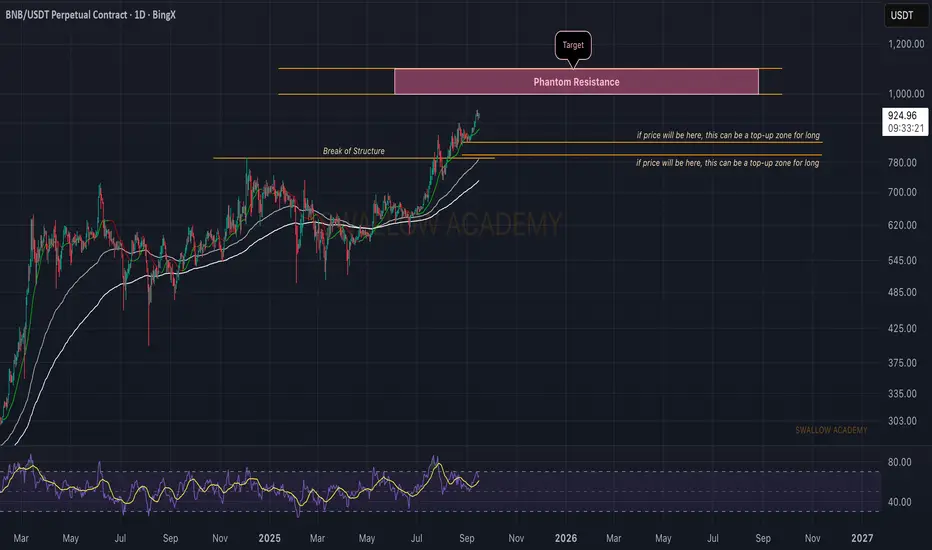
Binance Coin (BNB): 4 Digit ATH Incoming | $1000BNB has been holding strong after the breakup of the structure and is now moving closer to the phantom resistance zone (the new ATH). Buyers are keeping the momentum, and as long as this push continues, we’re looking for the price to reach the $1,000–1,200 area. Any retest of the lower support zones could provide an opportunity to add to long positions.
Swallow Academy
$BNB NEW ATH - GO TO 1000CRYPTOCAP:BNB Ascending triangle with a breakout at the top, candle closes strongly. See how the price develops in search of the target on the chart pattern.

BNB CAN MAKE A NEW ATHi think BINANCE:BNBUSDT still bullish and can make a new ATH in the next Hours . i don't know how far it can reach but a new ATH is in plan!
best entry point can be in 4H FVG

BNB; ATHHello friends
Given the recent growth we have had, the price has formed a double top pattern and is in the specified support areas, we can expect the price to be supported until the specified targets.
*Trade safely with us*

BNB/USDT: Bullish Climb to 965?As the previous analysis worked exactly as predicted, BINANCE:BNBUSDT is gearing up for a bullish move on the 4-hour chart , with an entry zone between 859-868 near a key support and trendline.
First target at 930 marks initial resistance, while the second at 965 signals a potential breakout. Set a stop loss on a daily close below 840 to manage risk effectively. 🌟
A break above 875 with solid volume could trigger this climb, driven by BNB ecosystem news and market momentum. Watch BTC trends! 💡 Ready for this rise? Drop your take below! 👇
📝 Trade Plan:
✅ Entry Zone: 859 – 868 (support + trendline area)
❌ Stop Loss: Daily close below 840 to manage risk
🎯 Target 1: 930 (initial resistance)
🎯 Target 2: 965 (potential breakout zone)
Ready for this rise? Drop your take below! 👇


BNB is forming a bearish double top pattern📊 CRYPTOCAP:BNB Market Update
CRYPTOCAP:BNB is forming a bearish double top pattern 🔻 and is now testing the blue support zone 🔵. Watch closely — if support breaks, further downside could follow.
DeGRAM | BNBUSD above the $900 level📊 Technical Analysis
● BNB/USD has confirmed a breakout above the 900 level, turning former resistance into support while price continues to respect the ascending channel.
● The structure points to bullish continuation, with buyers likely targeting the 1,000 psychological level if the 900–910 zone holds as a base.
💡 Fundamental Analysis
● Binance’s recent efforts to expand regulatory compliance and strengthen its ecosystem continue to support investor confidence, reinforcing BNB’s role as a core exchange token.
✨ Summary
Bullish above 900; targets 950 → 1,000. Invalidation on a close below 890.
-------------------
Share your opinion in the comments and support the idea with a like. Thanks for your support!

BNB: (BNBUSDT) ATH Would You Sell Or Hold!?BNB have shown a great significant move by breaking above $1000 for the first time in history it have been among the most favorable cryptocurrency asset of the year, which keeps surging up for couple of months.
Meanwhile do you think it is good to buy and invest at this time..?
Like and follow up my page for more market updates.
Thanks for reading.

The Impact of News on Price: Should You React?"
In trading, news has always been a powerful factor capable of moving markets by double digits within hours. A single headline in the financial media or a tweet from a politician can send an asset soaring or crashing, wiping out stop-losses and creating waves of panic. Many traders have faced moments when a sudden “breaking story” ruined carefully built plans: technical analysis showed a steady trend, but a flood of headlines turned the market in the opposite direction. Naturally, the question arises: should we react to news immediately, or is it better to stay calm?
Most traders make their biggest mistakes during such moments. The temptation appears to jump straight into a position or close one in fear. Emotions take over: fear of missing out and greed for quick profits. The problem is, these decisions rarely come from a system. More often, they turn trading into gambling, where outcomes depend on luck instead of analysis.
The truth is, news itself doesn’t always have a straightforward impact on the market. What matters more is how participants react. The same piece of information can trigger a rally or a sell-off depending on how major players interpret it. Blindly following the headlines rarely leads to consistent results.
A more effective approach is to treat news as background, not as a direct call to action. At the core of successful trading lies discipline and an understanding of levels, not headlines. If the price is approaching a pre-marked zone, that zone—not a comment on a news feed—defines the scenario. This way, the trader avoids guessing crowd reactions and focuses on what is objectively visible on the chart.
Consider two scenarios. In the first, a trader sees news that a large fund has purchased crypto and instantly opens a long. In the second, the same trader reads the same news but acts only after confirming the move technically, at pre-defined levels. The difference is striking: the first approach is emotional, the second is structured. And it’s the latter that reduces chaotic mistakes.
To trade this way, it’s not enough to simply recognize levels—you need a system to control them. That’s where structured analysis comes in: viewing price step by step, turning trading into a managed process. With this approach, profit targets, risk zones, and scenarios are mapped out in advance. Strong news flow becomes a side factor, not the core driver of decisions.
Experienced traders know that news will always shake markets. Instead of chasing every headline, it’s more effective to build trades that can withstand volatility. What helps here is having a process that removes emotions and focuses on numbers. Automation of analysis and clear visualization of key levels transform trading from chaotic reactions into a disciplined plan.
So, should you react to news? The answer is: yes, but not directly. React through your system. If the news aligns with the technical picture, it can add conviction. If it contradicts it, the priority remains with structure, not emotion. This is what allows you to operate calmly, without panic or euphoria.
Markets will never stop being unpredictable, and news is just one facet of that uncertainty. But discipline, technical analysis, and structured control can turn even the noisiest events into a manageable process. In the end, it’s not the headlines that matter most, but your ability to stay focused and consistent. And this is exactly where tools that automate the process, reduce chaos, and keep logic at the center become indispensable."
#BNBUSDT - Aug 2025Date: 17-08-2025
#BNBUSDT - Current Price: $853.38
#BNBUSDT Pivot Point: $840.99 Support: $808.51 Resistance: $873.75
#BNBUSDT Upside Targets:
--------------------------------
| Target | Price |
---------------------------------
| 🎯 Target 1 | $914.20 |
| 🎯 Target 2 | $954.65 |
| 🎯 Target 3 | $997.27 |
| 🎯 Target 4 | $1,039.89 |
#BNBUSDT Downside Targets:
| 🎯 Target 1 | $767.92 |
| 🎯 Target 2 | $727.33 |
| 🎯 Target 3 | $684.70 |
| 🎯 Target 4 | $642.08 |
#Crypto #Bitcoin #BTC #CryptoTA #TradingView #PivotPoints #SupportResistance
#SOLANA #ETHEREUM #BTCUSD #MATICUSDT #XRPUSDT

BNB THE $1000 ATH on wayBNB did a new ATH and can complete it over $1000 in the coming time, which makes BNB a strong coin movement.

$BNB entering a SHORT POSITION at $1056I have decided to short CRYPTOCAP:BNB based on the DAILY chart alone.
Entering now SHORT $1056
STOP LOSS: $1115
TAKE profits: $960
RSI very overheated at 81, Wave 5 finishing rally on all main timeframes, LIQUIDITY trapped below the $980 mark from late longs, bear RSI divergences on many longer timeframes, including MONTHLY.
And #bnb has just hit the TRIANGLE (a pattern that started in DEC 2024 and broke out in MAY initially) target at $964 on the DAILY.
Risky long, but I like this trade especially on a Sunday early afternoon 💙👽

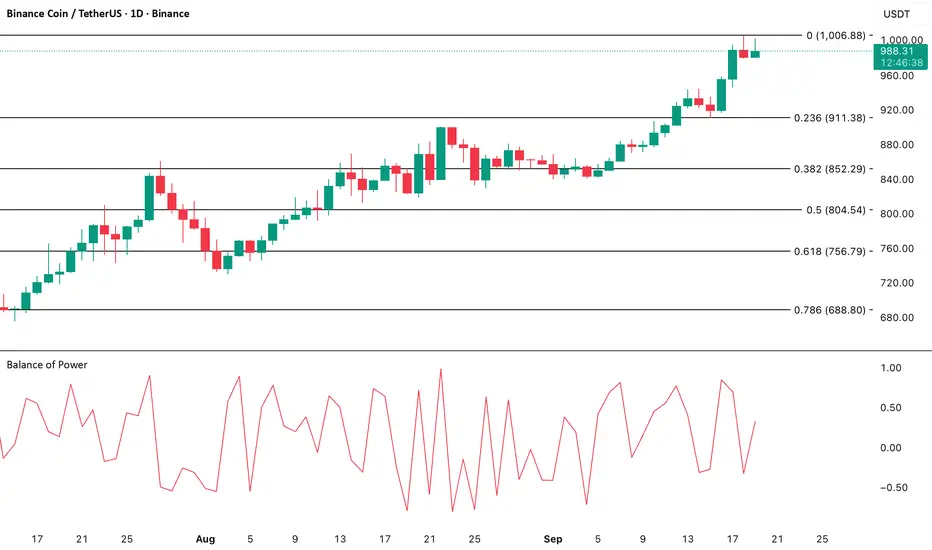
BNB Buyers Hold the Upper HandBNB’s rally above the $1,000 mark has captured the attention of traders. Although the price has eased slightly lower, the coin remains close to its peak, supported by strong bullish sentiment in the market.
The Balance of Power (BOP) indicator currently stands at 0.28, signaling buyers’ dominance. This positive reading suggests bulls remain firmly in control despite BNB’s minor pullback from record highs.
If bullish momentum continues, BNB could retest its all-time high at $1,001 and push for a breakout above it. However, if profit-taking intensifies, a correction lower.
BNB/USDT – 1H OutlookBNB is currently retracing upward into a key supply zone after a recent break of structure to the downside. This supply area stands as a critical decision point, where sellers may look to regain control and drive the price lower. The overall market structure remains bearish, suggesting that this upward move could simply be a temporary pullback rather than a full trend reversal.
If price action shows rejection within supply, it may confirm continuation of the bearish momentum, opening the way for a move towards the lower demand zone. On the other hand, a strong breakout above supply would delay bearish confirmation and potentially allow buyers to extend the rally further.
At this stage, monitoring price behavior within supply is crucial, as it will determine whether the market respects the bearish structure or attempts a short-term shift in sentiment.
