BNB Weekly Demand Zone Reversal Ready
#BNB Binance Coin is reacting strongly from the 0.786 Fibonacci demand zone, showing early signs of a major trend reversal📉➡️📈
As long as price holds this weekly support block, BNB is positioned for a powerful breakout in the coming weeks.
🎯 Targets:
• $1,296.11
• $1,456.54
Trade ideas

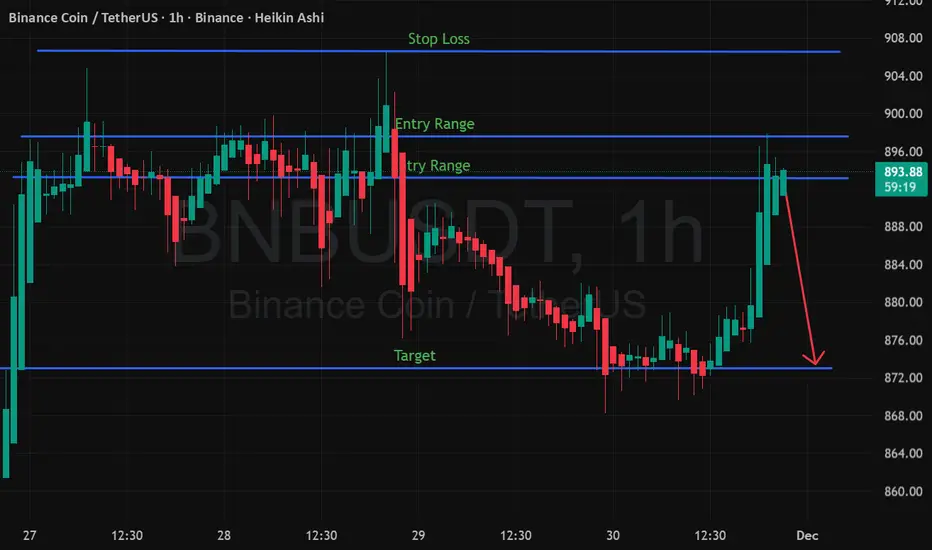
BNB Sell Signal Generated — Levels Inside🔽 Trade Setup
Sell Zone: 893 – 892
Stop Loss: 910
Target: 875
📊 Why This Matters
BNB has shown signs of weakening momentum near the upper resistance band. The recent candle structure plus volume behaviour suggests sellers are stepping in, creating a short opportunity in this zone.
🎯 Target Expectation
Price is expected to test the 875 support zone, where demand previously reacted strongly. Risk-to-reward remains favourable as long as price stays below 910.
⚠️ Risk Management
Always follow your SL and manage position size according to your strategy.
This is not financial advice — only for educational purposes.
FireHoseReel | BNB Daily Analysis #9🔥 Welcome To FireHoseReel !
Let’s dive into the current BNB market structure and key levels.
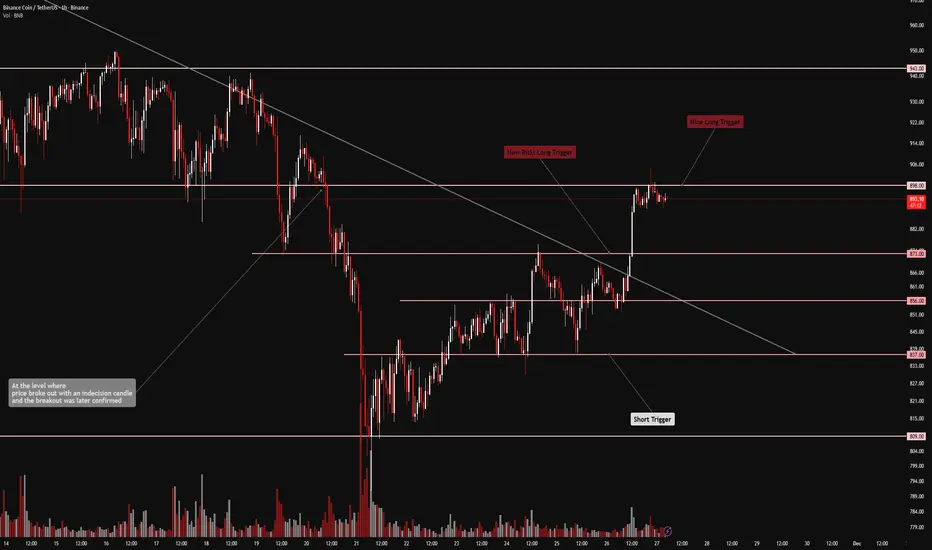
👀 BNB – Market Structure & Trade Scenarios
After activating its trigger, BNB is currently trading just below a key resistance zone.
A clean breakout above this resistance could activate our long trigger, making this area a very strong zone for potential long positions after confirmation.
📊 Volume Behavior
Pay attention to volume — over the past few days, volume dropped noticeably, but we’re now seeing early signs of rising buy volume.
While this increase may not be fully visible on the 4H timeframe, on multi-timeframe analysis, the growth in buying pressure toward this resistance is clearly forming.
✔️ BNB/BTC – Relative Strength Check Looking at the BNB/BTC pair, price is currently sitting near a strong support level.
If this support is lost, it would signal a decline in BNB’s relative strength versus Bitcoin.
However, a solid reaction and bounce from this level could help trigger the resistance breakout on the BNB/USDT pair.
On the 4H timeframe, BNB/BTC still holds a slightly bullish structure, but on higher timeframes it appears bearish, meaning we must stay cautious.
📌 Trading Scenarios for BNB
Below are the key scenarios that can be used alongside your own trading strategy:
🟢 Long Scenario
A breakout above $898, confirmed with rising buy volume, can activate our long trigger and offer a valid buy entry.
The current area is a good preparation zone for a potential long after confirmation.
🔴 Short Scenario
For shorts, it’s best to focus on naturally bearish patterns, as supported by Dow Theory, such as:
• Failure Swing
• Non-Failure Swing
• Double Top
A break of newly formed lows with increased sell volume can present strong short opportunities.
🛞 Risk Management & Disclaimer
Please remember to always use proper risk management and position sizing. Nothing in this analysis is financial advice. The market can change quickly, so always trade based on your own strategy, research, and risk tolerance. You are fully responsible for your own trades.

FireHoseReel | BNB Daily Analysis #8🔥 Welcome FireHoseReel !
Let’s dive into the current BNBUSDT Structure .
🔷 BNB Market Update & Trade Scenarios
After our initial trigger was activated, BNB moved higher and the long position was successfully entered. Price is now trading at a major resistance zone, and a confirmed breakout above this area could activate the next long trigger. If the position had been opened earlier with a lower-risk entry, this secondary trigger would now provide a strong opportunity to scale into the position with confirmation.
📊 Volume Insight
From a volume perspective, the breakout and acceptance above the 873 level were supported by a clear expansion in trading volume, confirming strong buyer participation. During the pullback phase, volume noticeably declined, which signals a healthy and controlled correction, not aggressive distribution. For continuation toward the 898 resistance, we now need to see a fresh and decisive increase in buying volume to validate sustained bullish momentum.
📌 Below are the key scenarios based on the current BNB market structure, which can be used alongside your own trading strategy. 👇🏻
🟢 Long Scenario
A clean breakout above the 898 resistance, confirmed by a strong bullish candle close and rising buy volume, could offer a high-quality long setup.
The stop-loss can be safely placed below the most recent local low to maintain a favorable risk-to-reward profile.
🔴 Short Scenario
If price forms a lower high followed by a lower low, or prints a bearish structure such as a failure swing or non-failure swing, with volume confirmation, a valid short setup may emerge—especially since the higher-timeframe market cycle still carries bearish pressure.
🛞 Risk Management & Disclaimer
Please remember to always use proper risk management and position sizing. Nothing in this analysis is financial advice. The market can change quickly, so always trade based on your own strategy, research, and risk tolerance. You are fully responsible for your own trades.
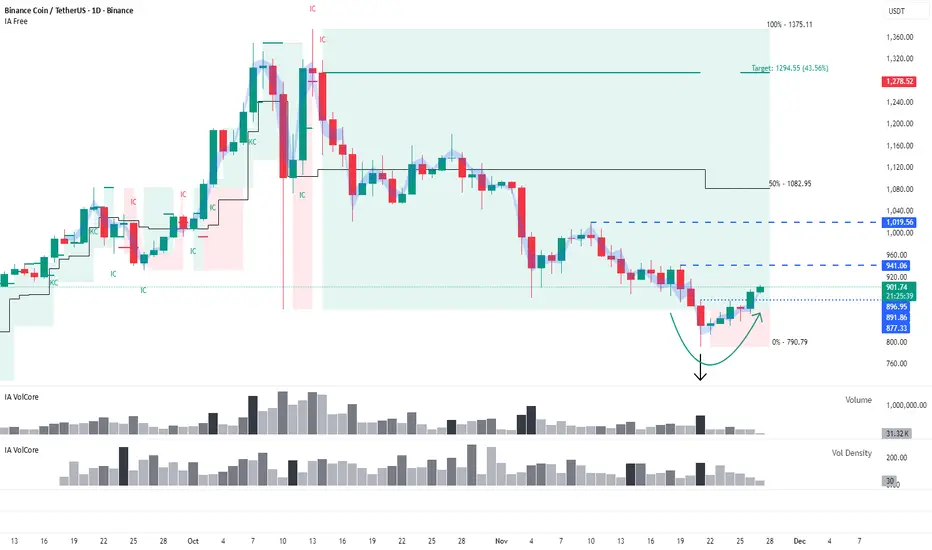
BNB: Long setups remain a priorityBuyers may still show strength despite the lack of interaction with a key level.
This analysis is based on the Initiative Analysis (IA) method.
Hello traders and investors!
On the daily timeframe, the market is in a sideways range, and a false-break pattern of the lower boundary has formed.
We see a seller’s attack on volume at the level, followed by a bullish absorption of the attack candle.
There is one detail: during the formation of this pattern, the price stopped roughly 11 dollars short of the 50% level of the monthly trading range.
Even with this nuance, the long scenario remains valid.
The first target is 941.
Wishing you profitable trades!
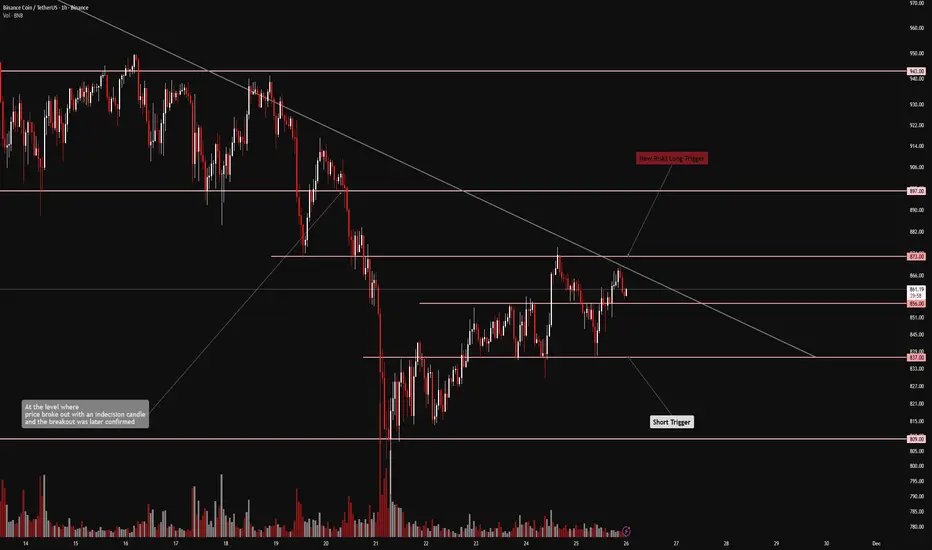
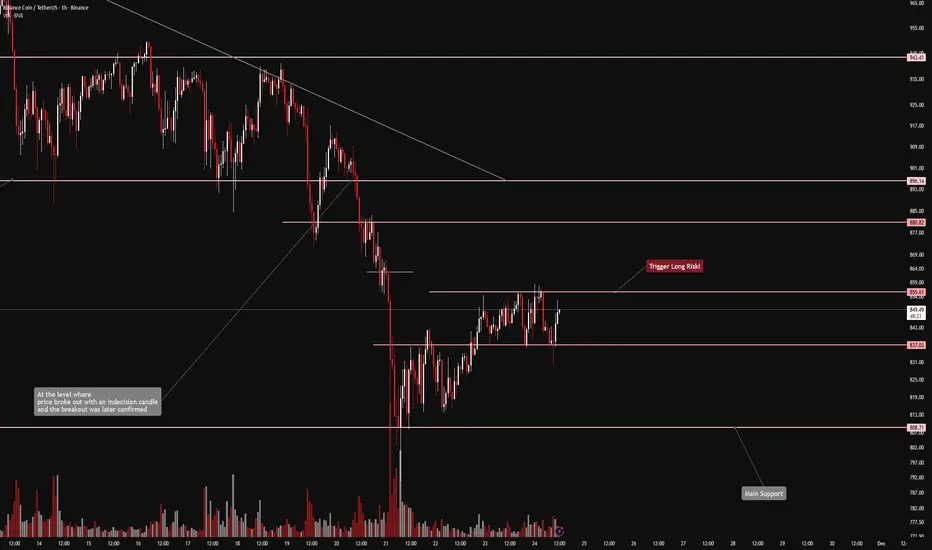
FireHoseReel | BNB Daily Analysis #7🔥 Welcome FireHoseReel !
Let’s break down the current BNB structure and important triggers.
BNB – Short-Term Market Structure Update
Since yesterday, BNB formed an almost equal low around $837 and bounced upward. However, on the 1H timeframe, it printed a lower high compared to the previous peak and failed to break the $873 resistance.
A break above the high activates our long trigger, while a break below the low activates the short trigger.
📊 Volume Analysis
Pay close attention to volume to understand internal market behavior.
After the heavy market drop, BNB formed a critical higher-timeframe support near $809, followed by a sharp drop in volume.
The first strong volume expansion, combined with trigger activation, will act as confirmation either for opening new positions or for holding existing ones.
🔁 BNB/BTC Perspective From the BNB/BTC pair, it appears price is possibly forming a fake breakout at the top of its trading range.
If this fakeout plays out, BNB’s relative strength against Bitcoin may weaken, allowing:
• BTC dominance to rise
• USDT dominance to increase
• And BNB to activate its short trigger
On the flip side, if BTC dominance and USDT dominance both drop, BNB can move upward, activating the BNB/USDT long trigger.
This potential fakeout is also accompanied by a volume divergence, which increases its technical significance.
📌 Trading Scenarios
The active scenarios for BNB are outlined below and can be used depending on how price reacts.
🔼 Long Scenario
• A breakout above the multi-timeframe high at $873
• Must be accompanied by a clear increase in volume
This provides a risky long setup toward the next resistance.
If that resistance shows signs of breaking, we can add to the position, since the main long trigger sits at $897.
🔽 Short Scenario
• A breakdown below the newly formed support at $837
• Must be confirmed by a strong increase in sell volume
• Only with volume confirmation does this become a valid short trigger.
🛞 Risk Management & Disclaimer
Please remember to always use proper risk management and position sizing. Nothing in this analysis is financial advice. The market can change quickly, so always trade based on your own strategy, research, and risk tolerance. You are fully responsible for your own trades.
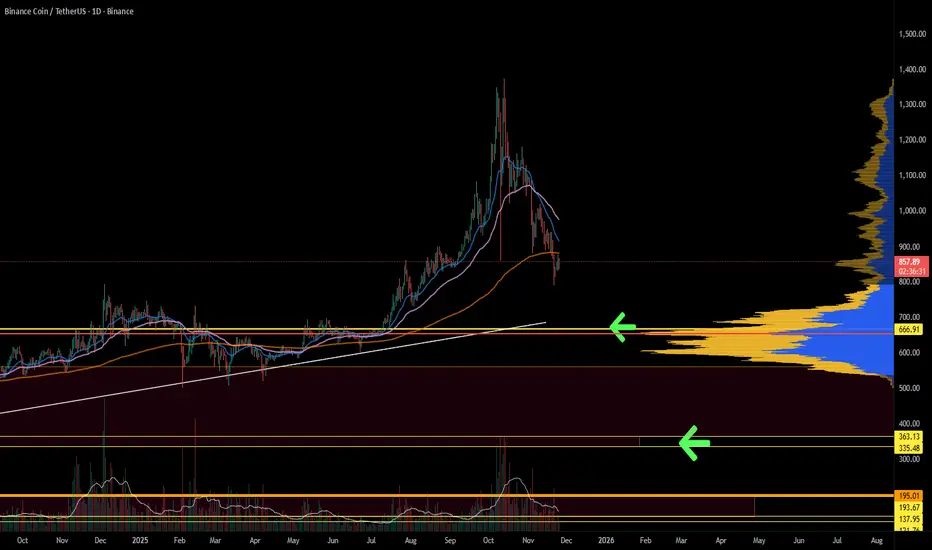
Binance Chain is falling and may find support soon. BNB just bounced off the 200D MA but momentum is still weak.
The key support is the high-volume node around 660 — lose that and price likely slides into the 360–330 demand zone.
Indicators are oversold, but no bullish confirmation yet.
MACD is still trending down + structure looks like a full reset of the prior run.
Bottom line: sitting on support, but bears still control until buyers show strength.
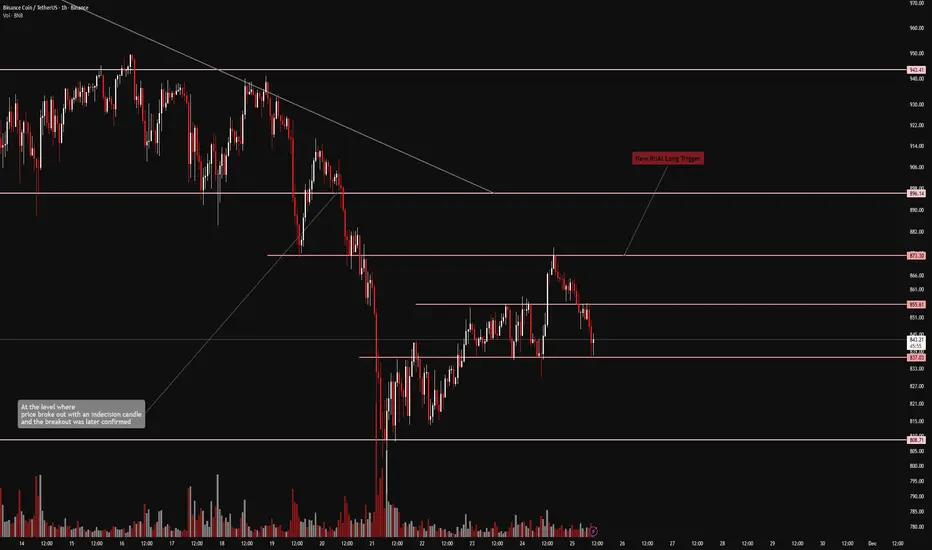
FireHoseReel | BNB Daily Analysis #6🔥 Welcome FireHoseReel !
Before we jump into the analysis, just a quick note — I’ve slightly adjusted my trendline placements. Ready? Let’s break it down.
🔼 Breakout, Retest… Then Stop Hunt
BNB broke the $855 resistance, activated the long trigger, and briefly pushed upward.
That resistance then turned into support — but price quickly rejected from the upper zone and moved downward, hitting the stop.
Now, the same rejection zone has turned into our new long trigger.
A clean breakout above this level opens the door for another long entry.
📊 Volume Behavior
BNB’s volume during the breakout was strong — a classic whale candle triggered the long setup.
(As always: after a whale candle, the safest move is not entering immediately.)
After that spike, buy volume faded and sellers stepped in, pushing BNB downward.
Volume reduction in pullbacks + pressure from sellers explains the move perfectly.
🔁 A Different Perspective — BNB/BTC Looking at the BNB/BTC pair gives us earlier signals.
This pair is currently ranging, showing that BNB’s behavior highly mirrors BTC’s movement.
The triggers here align well with the BNB/USDT structure, giving confluence across markets.
📌 Today’s Trading Scenarios
🔼 Long Scenario
• A long setup becomes valid if:
• Price breaks above $873
• Buy volume increases
• Sell volume decreases during pullbacks
• This would confirm strength and activate a clean long entry.
🔽 Short Scenario
A short setup becomes valid if:
• Price breaks below $837
• Strong selling pressure appears
• Sellers dominate lower-timeframe reactions
• This would confirm bearish continuation into lower support zones.
🛞 Risk Management & Disclaimer
Please remember to always use proper risk management and position sizing. Nothing in this analysis is financial advice. The market can change quickly, so always trade based on your own strategy, research, and risk tolerance. You are fully responsible for your own trades.
FireHoseReel | BNB Daily Analysis #5🔥 Welcome FireHoseReel !
Let’s dive into the analysis of BNB (Binance Coin).
👀 BNB – 1H Timeframe Analysis
On the 1-hour chart, BNB is currently moving inside a clear trading range.
If the top of the range breaks, we get a risky long trigger.
If the bottom breaks, we get a clean short trigger.
We now have to wait and see which direction the market chooses so we can position ourselves accordingly.
Since USDT.D is still high, I personally lean slightly more toward a bullish reaction from BNB.
📊 Volume Indicator Insight
Pay close attention to the volume indicator.
It clearly shows that BNB is range-bound, because volume has been declining inside this box.
A breakout from the range will represent reduced absorption + a new directional move.
So the first strong volume spike will likely give us a valid entry signal.
✔️ A Different Perspective – BNB/BTC Pair Checking the BNB/BTC pair helps a lot.
Just like before, it’s still moving inside its own box, but currently leaning slightly downward.
This means BNBUSDT is behaving similarly to BTCUSDT, and the triggers become much clearer when analyzing both pairs together.
Trading Scenarios
Related entry scenarios are written in the continuation of the analysis and can be used depending on how price reacts.
🔼 Risky Long Scenario
A long position becomes valid if:
• $855.61 resistance breaks, and
• A noticeable increase in buy volume confirms a clean breakout from the trading range.
🛞 Risk Management & Disclaimer
Please remember to always use proper risk management and position sizing. Nothing in this analysis is financial advice. The market can change quickly, so always trade based on your own strategy, research, and risk tolerance. You are fully responsible for your own trades.
FireHoseReel | BNB Daily Analysis #3🔥 Welcome FireHoseReel !
Let’s dive into the analysis of BNB (Binance Coin).
👀 BNB – 1H Timeframe
On the 1-hour chart, BNB has formed a solid support around $808.17, right after the drop we mentioned in previous analyses.
Price also has a local resistance at $842.26, and a breakout on either side can give us confirmation for the next move.
However, going long from this zone is not ideal. A long setup would be more reasonable at higher levels during a pullback of this bearish leg — and for that, we need USDT dominance to reject downward.
📊 Volume Analysis
Looking at volume, one key detail stands out:
The multi-timeframe correction of this bearish move has come with decreasing buy volume.
If price moves back down and breaks the support again, we can look for a fresh short position.
✔️ BNB/BTC Pair Analysis Since we analyze things differently, let’s also check the BNB/BTC pair.
This pair is currently sitting on its own support and moving slightly upward.
But what matters is this: BNB/BTC seems to be forming a potential bearish pattern on this timeframe. If the structure completes, I’ll include it in the next analysis update for you.
✍️ Now let’s check the trading scenarios for BNB on the 1H timeframe.
🔽 Short Scenario
A short setup becomes valid if:
• BNB/BTC breaks below 0.009691,
• Confluence with BNB price breaking below $808.71,
• Increased sell volume,
• A clean candle close under the defined support zones.
This combination gives us a strong short trigger.
🔼 Long Scenario
A long setup requires:
• Breakout above $896,
• A few retests (rejections) into this zone,
• Followed by a confirmed breakout with increased buy volume.
This long scenario is still far from current price, and once BNB reaches that zone, I’ll post the best updated scenario for you.
🛞 Risk Management & Disclaimer
Please remember to always use proper risk management and position sizing. Nothing in this analysis is financial advice. The market can change quickly, so always trade based on your own strategy, research, and risk tolerance. You are fully responsible for your own trades.

BNB is cooked...$850 target hit This is a follow up post for my call a month ago. After seeing the highs get taken I knew that BNB was going to be bearish if the 1200 level doesnt hold. Here we are..

BNB contin short ?The RSI divergence, even after several failed breaks, eventually played out nicely, and we got a solid move down from the peak levels.
I’m starting to gradually close my short position (in profit).
Since the trade has been open for quite a while, the accumulated funding is a nice bonus as well.
As price approaches the lower trendline, I’ll close 50% of the position and move my stop to breakeven (entry price).
A small bounce from here is possible.
The trendline on the weekly chart aligns with a strong Fibonacci level (0.618) on the 4H timeframe, so if we consolidate below this level, the move down can easily continue.

BNBUSDT: Update On Todays Market.BNBUSDT is at the crucial support area, this zone happens to be solid as price rejects to break below it. we can spot how the price is gradually heading up above the support, aiming for $1,080 as the potential target.
Meanwhile there might be a breakout anticipation below the support.
Key points;
More reversal confirmation from this major zone, would set off upward rise to $1,080 and above.
Lets see how it plays out..
Thanks for reading.

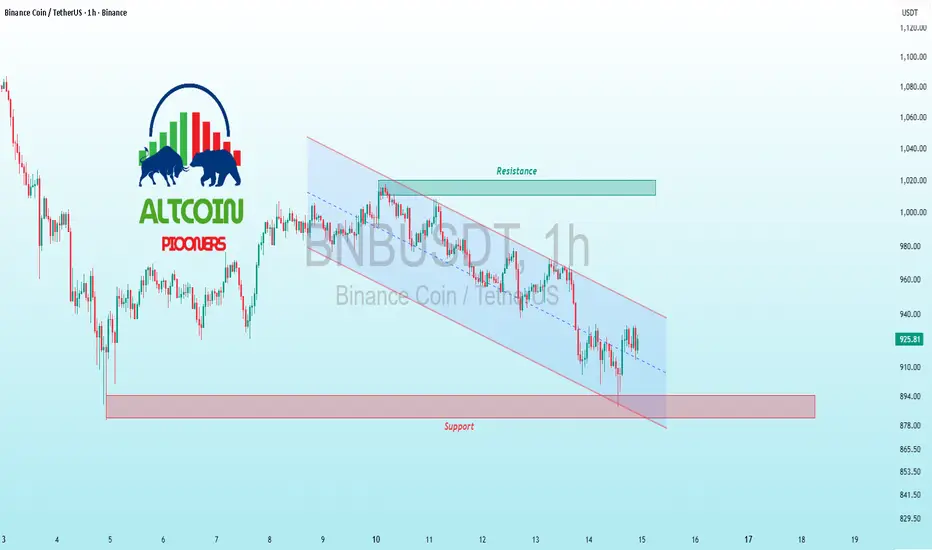
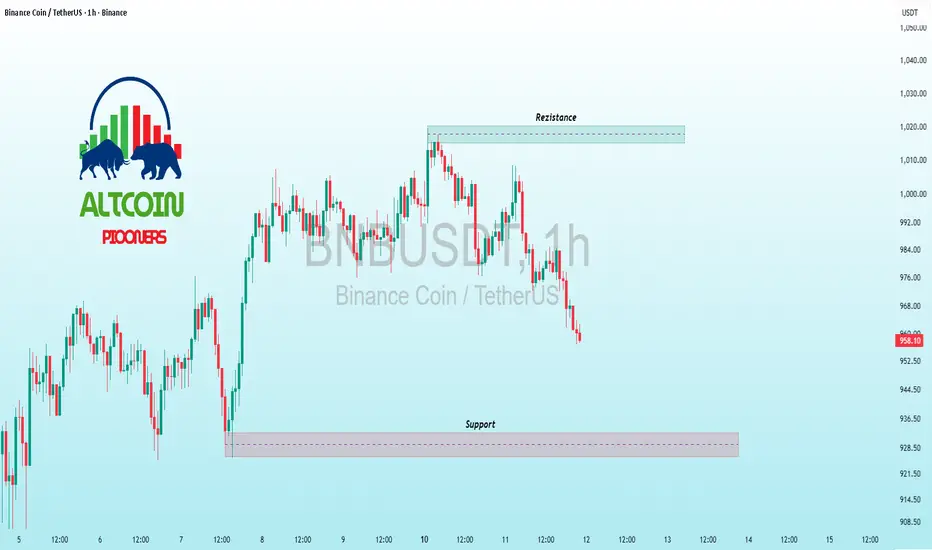
$BNB Trendline Tug-of-War – Bulls Defend or Bears Feast?BINANCE:BNBUSDT CRYPTOCAP:BNB Trendline Tug-of-War – Bulls Defend or Bears Feast?
Altcoin Pioneers! 🐂 BNB/USDT 1H is locked in a descending channel battle, price dipping to test support at ~895 after bouncing off the orange trendline resistance near 910. Binance ecosystem strength holding the line, but that red candle close warns of fading momentum amid broader crypto caution.
Hold support? Decent shot – volume drying up on downside, RSI at 42 eyeing bullish divergence for a snapback. Breakout above resistance? Bullish if >905 clears on BNB Chain news, targeting 920. Deeper dip risk? Real threat – snap below eyes 880 (50 EMA), chain reaction selloff.
Target: Reclaim 905 on hold, drop to 885 on breach. Monitoring: EMA ribbon compression, CCI for overextension, and BNB/BTC ratio for decoupling. Chain up! 🔗📉
#BNB #AltcoinAnalysis #TradingView

BNB Capital Sector. Price Slice TF 2M 1495.81 🏷 BNB Capital Sector. Price Slice TF 2M 1495.81
🏷 Capital Sector. Price Slice (Limited Version)
Full version from 1 year and above available in the database library.
🏷 601.4871 — Price not present at time of publication
🏷 657.3 — Price not present at time of publication
🏷 816.6 — Price not present at time of publication
🏷 1495.81 — Price not present at time of publication
TF 1D:
TF 1H:
TF 1M:
TF 3M:

$BNB Testing Key Support Amid Bearish PressureBINANCE:BNBUSDT CRYPTOCAP:BNB Testing Key Support Amid Bearish Pressure
BNB is grinding lower in a short-term downtrend, now testing major support at ~$585.
Bullish bounce possible if it holds—eyes on a breakout above $615 resistance for a push to $630 target.
But watch for deeper dip risk to $550 if support cracks.
Key indicators: RSI dipping toward oversold (bullish divergence), MACD histogram flattening, and 50/200 EMA death cross signaling caution. 📉🚀
#BNB #CryptoTrading #AltcoinAnalysis
$BNB Channel Breakdown – Support Lifeline?BINANCE:BNBUSDT CRYPTOCAP:BNB Channel Breakdown – Support Lifeline?
Current trend: BNB's sliced through the descending channel, now grinding toward the 911 support after rejection from 1,020 highs—sellers aggressive, but volume drop signals potential trap 🛡️.
Hold support? Favorable yes; hammer wicks and prior lows could trigger a fierce bounce if volume flips green.
Breakout above resistance? Setup for 1,020 reclaim—could pump 5-7% to 1,050 on confirmation 🚀.
Dip risk? Heightened to 890 if cracks, riding BTC weakness.
Target: Rebound to 980 short-term; downside 880 buffer.
Indicators eyeing: RSI (28, deep oversold), Channel base test, and MACD divergence 📉.
#BNBTrading #CryptoSupport #AltcoinPioneers

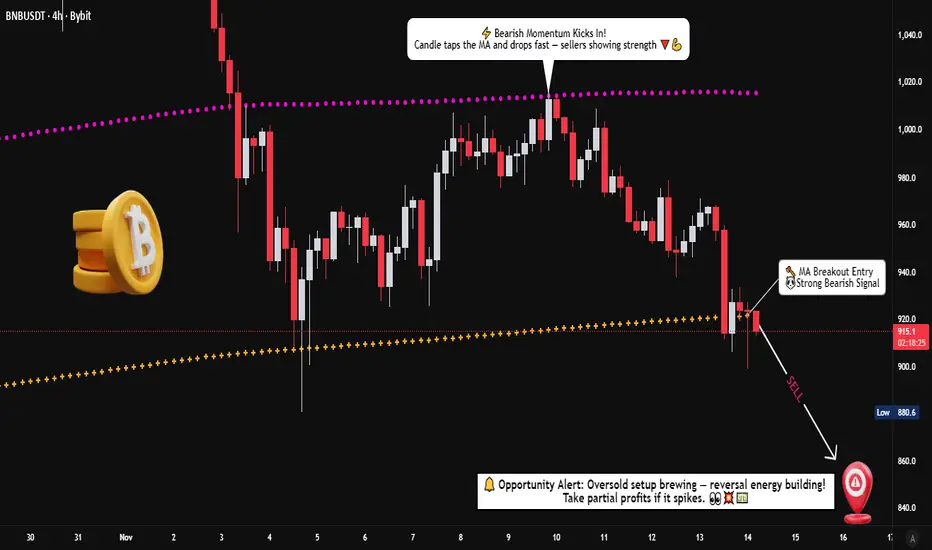
BNB/USDT – Momentum Shift Indicates Controlled Bearish Pressure📊 BNB/USDT: CRYPTO MARKET OPPORTUNITY BLUEPRINT | Swing Trade Analysis
🎯 TRADE SETUP OVERVIEW
Asset: BNB/USDT (Binance Coin vs Tether)
Timeframe: Swing Trade
Bias: 🔴 BEARISH | Confirmed via Weighted Moving Average Dynamic Support Breakout
📍 ENTRY STRATEGY: LAYERING METHOD
Entry Approach: Multiple Limit Order Layering (Dollar-Cost Average Entry Style)
Layer 1: $960.0 (Initial Entry)
Layer 2: $940.0 (Add Position)
Layer 3: $920.0 (Scale Entry)
💡 Customize layer levels based on your risk tolerance & capital allocation
🛑 STOP LOSS (SL)
Thief OG's SL Level: 🎪 $970.0
⚠️ CRITICAL: Place SL only after breakout confirmation is validated on price action
📌 Disclaimer: Adjust SL based on your personal strategy & risk management rules. This is YOUR capital at risk.
🎁 PROFIT TARGET (TP)
Target Level: 🏁 $850.0
Why This Level?
✅ Moving Average acts as strong resistance zone
✅ Overbought conditions present
✅ Previous support-turned-resistance trap identified
✅ Optimal risk-to-reward structure
📌 Disclaimer: This is a reference target. Take profits at YOUR discretion. Partial profit-taking recommended.
🔗 CORRELATED PAIRS TO MONITOR
Direct Correlations (High Impact)
1. ETH/USDT (Ethereum) - 📈 POSITIVE CORRELATION
Why Watch: BTC & ETH dominance typically drives altcoin movement
Key Point: If ETH breaks down, BNB often follows within 2-4 hours
Action: Use as confirmation signal for BNB downtrend continuation
2. BTC/USDT (Bitcoin) - 📈 POSITIVE CORRELATION
Why Watch: Bitcoin is the market leader; BNB is highly correlated
Key Point: Major Bitcoin support/resistance breaks precede BNB moves
Action: Monitor BTC for early trend reversal signals
3. BNB/BTC (Binance Coin vs Bitcoin) - 🔄 RELATIVE STRENGTH
Why Watch: Shows BNB's strength independently from Bitcoin
Key Point: If BNB/BTC weakens while BTC holds, downtrend is stronger
Action: Confirmation of bearish bias strength
Secondary Watch Pairs (Market Context)
4. USDT Dominance - 💰 INVERSE CORRELATION
Key Point: Rising USDT dominance = increased selling pressure on alts
Action: Check Tether flows into/out of BNB pairs
5. Crypto Fear & Greed Index - 📊 SENTIMENT INDICATOR
Why Watch: Extreme readings often precede reversals
Key Point: Greedy sentiment before drops = trap setup (like here)
Action: Validate bearish thesis with sentiment extremes
⚡ RISK MANAGEMENT CHECKLIST
✅ Breakout confirmation required before entry
✅ Risk:Reward ratio minimum 1:2 for this setup
✅ Position size = (Account Risk % × Capital) ÷ (Entry - SL)
✅ Scale entries across 3 layers to reduce slippage
✅ Monitor correlations for early exit signals
✅ Take profits in tiers: 33% at 900.0 | 33% at 875.0 | 34% at 850.0
📊 Summary
BNB has shifted into a bearish structure after losing dynamic support. With a layered entry method, flexible SL/TP management, and clear correlation signals across major crypto assets, this setup provides a properly structured swing opportunity for disciplined traders.
BNB - BINANCE 3 Hours Chart Opinions?🧠 Keep it on watch. Momentum shifting.
⚠️ Disclosures :
This analysis is for informational purposes only and is not financial advice. It does not constitute a recommendation to buy, sell, or trade any securities, cryptocurrencies, or stocks. Trading involves significant risk, and you should consult with a qualified financial advisor before making any investment decisions. Past performance is not indicative of future results.

$BNB Key Support Battle – Bulls or Bears Win?BINANCE:BNBUSDT CRYPTOCAP:BNB Key Support Battle – Bulls or Bears Win?
Current trend: BNB's cooling off from recent pumps, now range-bound near 955 after a healthy retrace—consolidation vibes with buyers eyeing that purple support floor for reload 🛡️.
Hold support? High chance yes; rejection wicks and steady volume on dips confirm defense at 930 zone.
Breakout above resistance? Primed if 1020 clears on close—could fuel 4-6% surge to prior highs 🚀.
Dip risk? Manageable to 920 if BTC wobbles, but bullish engulfing hints at limited downside.
Target: Short-term 1050 on break; stretch to 1080 with momentum.
Indicators eyeing: RSI rebounding from 35 (oversold), MACD line curling up, and 200 EMA as backstop 📈.
#BNBTrading #CryptoSupport #AltcoinPioneers

BNB Will Uppppppp soonOn the 1-hour chart of BNB, we are witnessing a kind of Elliott wave beginning and ending. I think that there is potential for growth in BNB as the dynamic trend line breaks and the necessary liquidity is gathered, as well as the 0.7 Fibonacci level of the previous uptrend is touched.

$BNB Solid Bounce from Support, Breakout Brewing?BINANCE:BNBUSDT CRYPTOCAP:BNB Solid Bounce from Support, Breakout Brewing? 📊🔥
BNB's 1H action remains bullish, defending key support at ~921 with solid volume—buyers stepping up!
Likely to hold firm, eyeing breakout over 1010 resistance for a push to 1050.
Deeper dip risk minimal (guard 910), but trail those stops.
Watching RSI ~52 (building momentum), 20 EMA hold, and MACD crossover for green light.
Alt gains loading! 🚀
#BNB #CryptoTrading #BullishAltcoins
$BNB Rejection at Resistance – Pullback or Rebound?BINANCE:BNBUSDT Rejection at Resistance – Pullback or Rebound?
BNB's 1H facing bearish rejection off resistance ~1,020 after brief push, now testing support at 970—hold here targets retest of 1,000, but breakdown risks dip to 950 amid low volume.
Bullish structure intact longer-term.
Key indicators: RSI dipping to 40 (bounce zone), 50MA flattening, MACD bearish divergence. Watch closely! 📉🔍
#BNB #BinanceCoin #AltcoinPioneers
