Scalp Long – BNB💎 Scalp Long – BNB
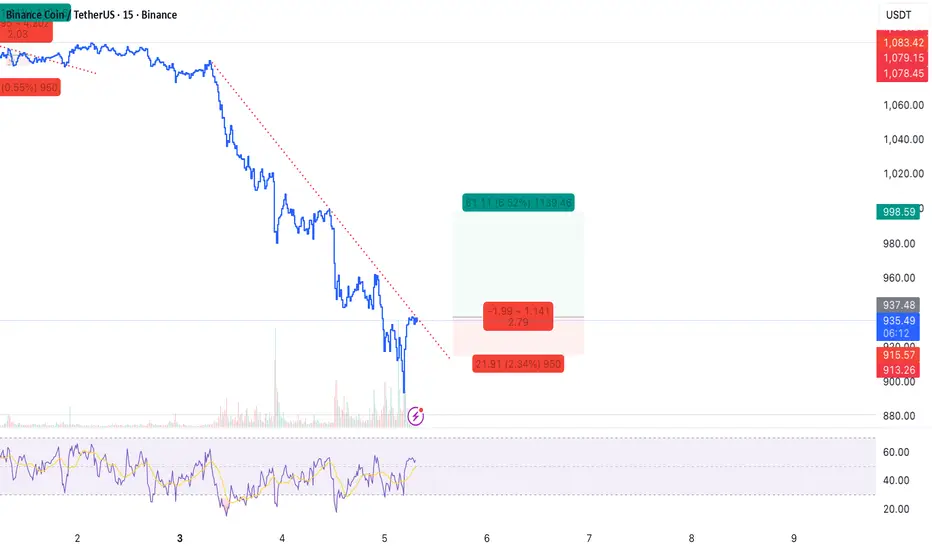
Price is consolidating before a potential breakout from the current downtrend. RSI remains in the buying zone, and strong buying volume indicates growing bullish momentum. A decisive breakout could trigger a sharp upward move with a favorable risk–reward setup.
🎯 Trade Setup:
→ TP: 998.6 | SL: 915.57 | RR: 1 : 2.79
Technical alignment between momentum, volume, and structure supports a high-probability long setup, aiming for a clean breakout continuation.
Trade ideas
BNB/USDT Setup – Will the Moving Average Confirm the Bull Move?💎 BNB/USDT – "BINANCE COIN VS TETHER" 💰
Crypto Market Opportunity Blueprint (Swing Trade)
📈 Plan: BULLISH
After a period of compression within a triangular structure, BNB is preparing for a potential breakout. The breakout above the triangular moving average could trigger a new bullish wave — offering a solid opportunity for swing traders!
💥 Entry:
✅ Any price level after confirmed breakout above the triangular moving average.
Patience = profits. Wait for confirmation to avoid fake moves.
🛑 Stop Loss:
This is the “Thief SL” @ 920.0 💀
⚠️ Note: Dear Ladies & Gentlemen (Thief OG’s) — adjust SL based on your strategy & risk appetite. Place it only after breakout confirmation, not before!
🎯 Target:
The moving average acts as a strong resistance zone, combined with overbought signals and potential trap activity.
Our target: @ 1120.0 💰
💬 Take profits smartly — your capital, your rules.
🧭 Related Pairs to Watch (Correlation Insight)
🔹 BINANCE:BTCUSDT – Bitcoin’s momentum drives most altcoin sentiment. A BTC breakout usually strengthens BNB bullish continuation.
🔹 BINANCE:ETHUSDT – Ethereum & Binance Coin often move in tandem within similar risk cycles; ETH strength confirms market-wide bullish tone.
🔹 BINANCE:SOLUSDT – Competes in smart-contract dominance; if SOL rallies, BNB tends to mirror short-term volatility shifts.
🔹 BINANCE:BNBBTC – Tracks BNB’s relative strength against BTC. Watch for BNB outperforming BTC — a hidden signal of accumulation by whales.
⚡ Key Points
Volume confirmation is crucial ⚙️
Wait for candle close above MA 🕒
Manage risk; don’t blindly copy setups 🚫
Follow the trend, not emotions 💭
🧠 Final Note:
This is not financial advice. Trade wisely, respect your plan, and remember — smart exits matter more than perfect entries.
🚀 Stay patient, stay sharp — Thief OG’s never chase, they calculate.

BNB: Inverse Head & Shoulders & Rising Channel StructureHi!
BNB has completed a clear inverse Head & Shoulders pattern at the bottom, with the neckline successfully reclaimed. After the breakout, the price is now moving inside a well-defined rising channel, showing steady bullish momentum.
The market has pulled back toward the midline of the channel, which lines up with previous neckline structure. If this support holds, the next leg higher remains the primary scenario.
Your projection highlights two key points:
A potential higher low forming inside the channel
Continuation toward the 1,031 resistance, with room for an extension toward the top of the channel
As long as the price respects the ascending structure and stays above the neckline/green zone, the bullish outlook remains intact.


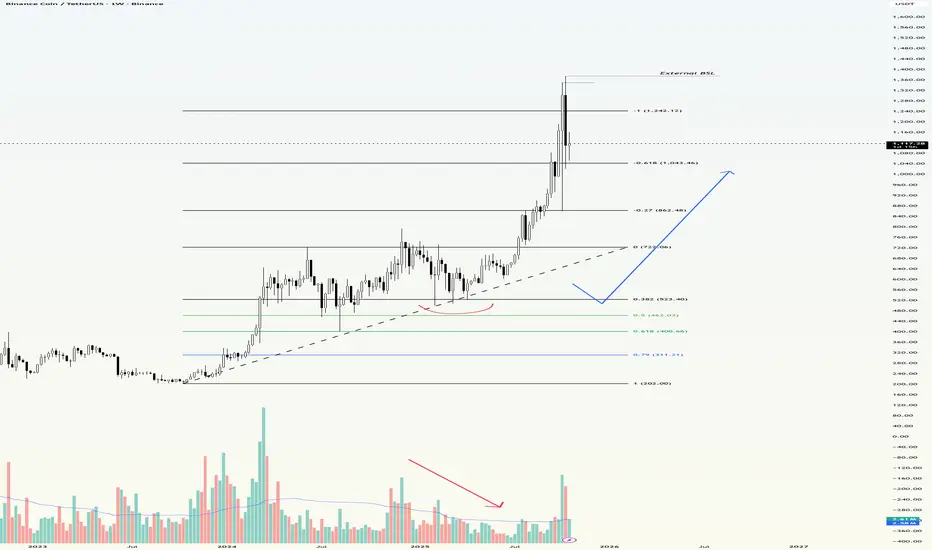
BNB Correction Phase After OverextensionAfter a strong impulse that pushed BNB to around $1,200, the market has entered a natural cooling phase.
The asset is now testing the key support area at $900–930, where the first signs of buyer reaction are emerging.
It looks like the market is trying to find balance after an overextended move.
Momentum remains, but signs of exhaustion are visible both in volume and price structure.
🔹 If buyers manage to hold the $950 zone and reclaim $1,000, we could see another leg up toward $1,1501,200.
🔹 If this support fails, the next liquidity pockets are sitting around $690-620, where large bids from funds are likely waiting.
Personally, I’m avoiding aggressive entries here the market needs time to digest the previous rally.
A deeper correction remains just as likely as a rebound.

BNB/USDT ideabased on market structure and volume, on 15m TF. we have are in a down trend with HL and LL confirmation, now with the rise of the price and the volume not following, I think we may have a good entry.

BNBUSDT.P - November 6, 2025A breakout and sustained close above resistance could confirm bullish continuation toward higher highs, while a rejection or breakdown below the ascending trendline and support may trigger a bearish move—trade according to how price reacts at these key levels.

BNB Holds $880 Support After Sharp CorrectionBNB has undergone a strong corrective move following its recent rally, with price rejecting from the $1,138 resistance zone — a level now confirmed as a key barrier to further upside. After this rejection, price action has reverted lower to $880, a crucial support level that now determines whether the market can stabilize and rotate higher.
Currently, BNB remains above the $880 mark, showing early signs of structural defense from buyers. This level serves as a technical pivot, where holding above it could lead to a short-term bullish rotation, while a breakdown would confirm deeper corrective potential.
Key Points:
- Resistance Established: The $1,138 region remains the primary upside barrier.
- Critical Support: $880 is the key level to hold for bullish continuation.
- Directional Bias: Holding above $880 favors a rotation higher, while a break signals further downside.
From a technical perspective, maintaining support above $880 keeps BNB within a constructive framework for recovery attempts in the short term.
What to Expect:
If $880 continues to hold, expect a retest toward $1,000–$1,050. A daily close below this level, however, would expose deeper downside toward $780, confirming further correction.

BNB reacts to BTC declines🔍 General Technical Situation:
The BNB price has broken below a key uptrend line that has been in place since June.
It is currently below the support level of ~1010 USDT, signaling a shift from higher lows to a potential downtrend.
📉 Key Levels:
Resistance:
1086 USDT → last local resistance after the trend breakout (a retest from below is possible).
1205 USDT → strong resistance from August and September.
Support:
912 USDT → local support (currently being tested).
831 USDT → next support, significant from the August structure.
733 USDT → strong demand zone from June-July.
📊 Volume:
In recent days, it has increased noticeably during declines—confirming selling pressure and the presence of large players liquidating positions.
🔄 Stoch RSI Indicator:
The Stoch RSI is at the lower end of the chart, close to the oversold zone (around 20–0).
This could indicate a short-term rebound, but not necessarily the end of the decline—rather, a potential retest from below the broken trend line (~1050–1080 USDT).
⚠️ Scenarios:
🟥 Bearish (more likely):
Price remains below 1010 USDT and rejects the 1080–1100 level in the event of a rebound.
Next downside targets: 912 → 831 → 733 USDT.
High selling volume suggests a test of lower levels may occur before demand stabilizes.
🟩 Bullish (less likely, but possible):
Price bounces from the 900–910 zone and returns above 1010 USDT with confirmed volume.
Only a close of the daily candle above 1080 USDT would negate the current bearish signal and could open the way to 1200 USDT.
📈 Summary:
Medium-term trend: broken, signal of weakness.
Short-term: possible technical rebound from 900–910, but the overall bias remains bearish.
Key level to watch: 1010 USDT – a return above this level would be the first positive signal.

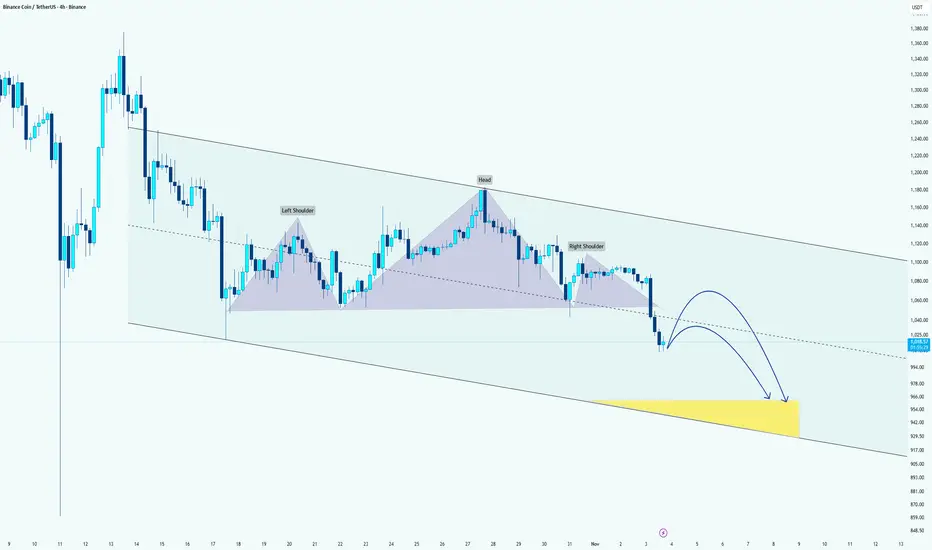
BNB Forming Head & Shoulders Breakdown Within Descending ChannelHi!
The chart shows a descending channel, indicating that the broader trend remains bearish. Inside this channel, we can see a Head and Shoulders pattern that recently broke below its neckline, confirming a potential continuation of the downtrend.
After the neckline breakout, price pulled back slightly but continues to trade under the broken support. The two projected blue curves suggest a possible short-term retracement toward the neckline or mid-range of the channel, followed by another move to the downside.
The yellow highlighted area marks a strong target/support zone between roughly $950–$970, which aligns with:
The bottom boundary of the descending channel, and
The measured move projection from the Head and Shoulders pattern.
As long as the price stays below the neckline and within the channel, the bearish bias remains intact. A clean break above the neckline could temporarily invalidate this scenario and lead to a relief rally, but overall, momentum favors a continuation toward the lower support zone.
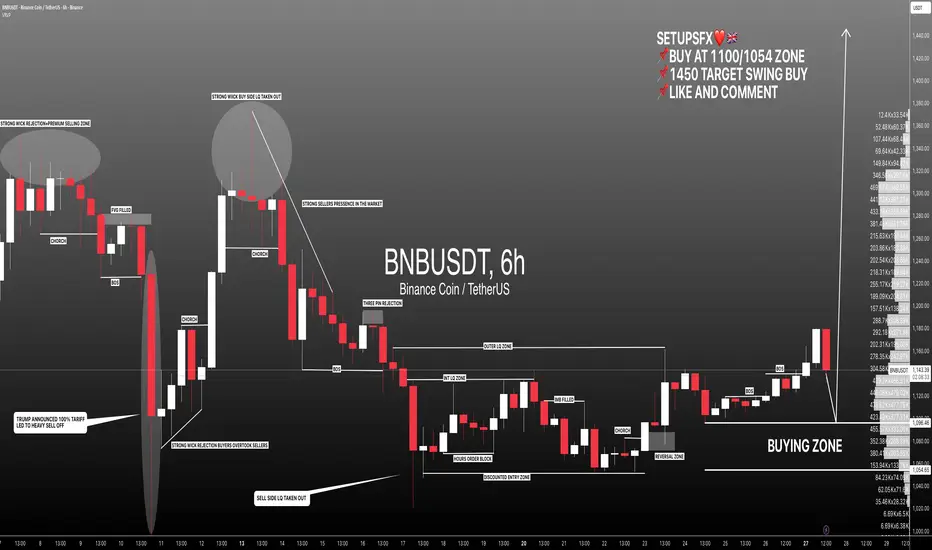
#BNBUSDT: Targeting 1450, One Swing Entry And Target**BINANCE:BNBUSDT**
Buyers still have control in the market in the daily time frame. However, there is still sellers’ pressure for the short term which is favourable. We want the price to reach our buying zone and move sharply upwards.
This is possible as there is major news coming up this week on Friday which is the Non-Farm Payroll (NFP) data. This economic data will influence the crypto market and other financial instruments.
Our target is to swing buy and close the position at 1450. However, the final closing price is at your discretion.
If you find our work helpful please like and comment.
Team Setupsfx_
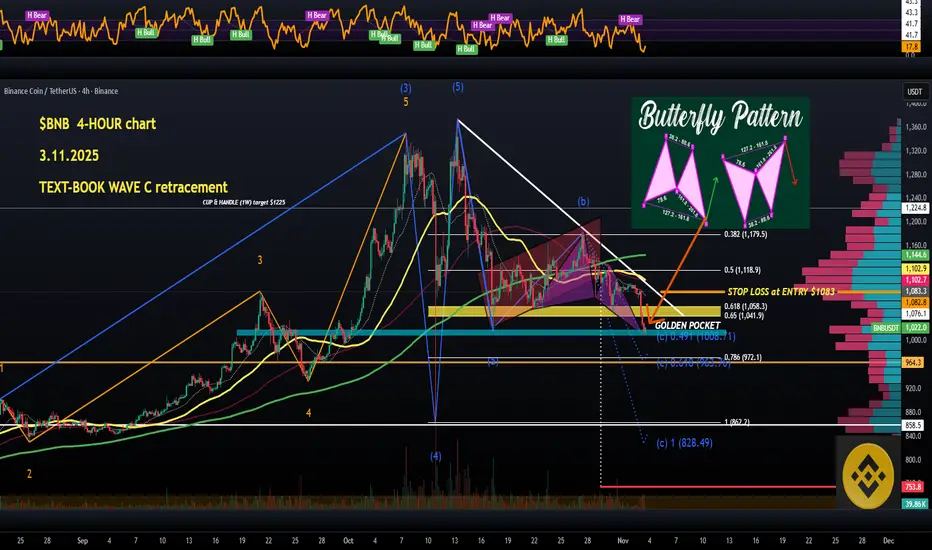
$BNB (4-HOUR): text-book WAVE C retracement, BULLISH BUTTERFLYSolid call on CRYPTOCAP:BNB so far — nothing changes except the GOLDEN POCKET is acting as our MAIN RESISTANCE zone.
Cross above, and I’ll reconsider my thesis.
One important new event is this bullish BUTTERFLY harmonic pattern that has a potential REVERSAL (to the upside, of course) zone right at an important previously pivotal support/resistance zone. That's a strong confluence, but losing that would be super BEARISH and great for my SHORT.
Now, the BULLISH case: if this BUTTERFLY gets confirmed, and the GOLDEN POCKET gets flipped back into SUPPORT - mega BULLISH.
My SHORT position is safe; moving STOP LOSS to my entry now — ZERO risk trade from now on. The US markets look rather strong on their pre-market charts.
Precious METALS as well — strong technical HIGHER LOWS printed all over their charts.
Macro is not BEARISH atm, just chaotic and uncertain.
I am going to drop a few other #Binance coin charts, the pairing ones, there are some additional signals in there.
👽💙
BNB LONGInstrument: Binance Coin (BNB/USDT)
Setup: Double bottom pattern, signaling a potential bullish reversal
Entry Zone: Area around the second bottom, confirmed by Fibonacci retracement levels
Target: Price objective set above resistance, following the double bottom breakout
Volume: Relative Weak volume on latest downward movements, no strong selling.
Strategy: Structured approach—enter on breakout with clear stop management, aim for the marked target zone

BNB Correction Expected to 1070 ZoneBased on the previous move, we’re likely to see a price correction in the opposite direction toward the 1070 area.

BNBThe chart cleary shows a strong long-term uptrend. After a long of consolidation, the price of BNB broke through key resistance levels and climbed above 1200 USDT, confirming a bullish trend.

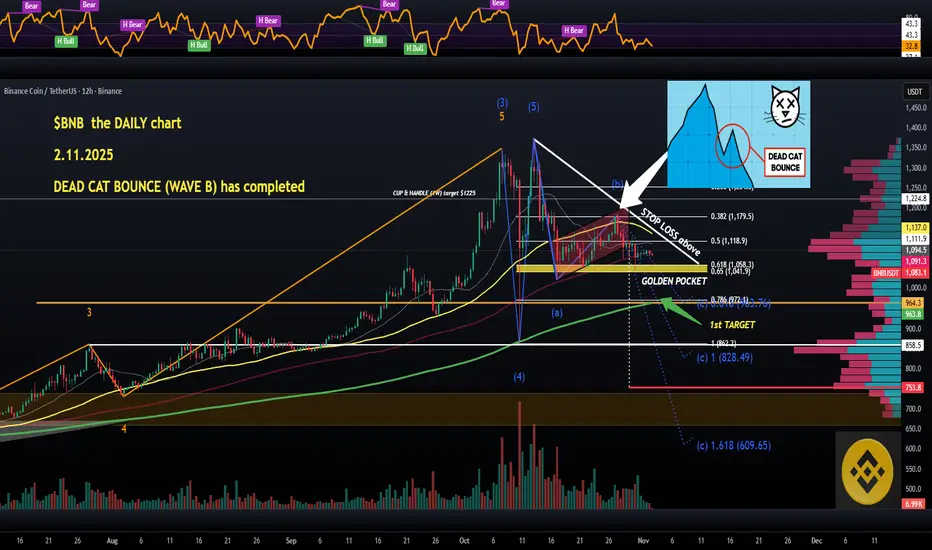
$BNB (12-HOUR): FULL EXIT from $BNB. And a SHORT from $1083Time for a big call, a full EXIT from CRYPTOCAP:BNB for me, the time has come. My latest spot entry at $1040 was based on the then-expected DEAD CAT bounce, and that's exactly what materialized.
The #Binance coin did precisely that, a WAVE B that peaked around the $1185 mark, and did NOT manage to reclaim the 50 MA (yellow) short-term momentum line in the sand.
The dead cat SURGE also ended at a textbook fib 0.382 level followed by a loss of the fib 0.5 level at $1119, and that was a BEARISH FLAG breakdown level (targeting... $753, yes).
So, the BEAR FLAG breakdown, the textbook completion of WAVE B dead cat, the down-curved 50 MA in confluence with the FALLING TRENDLINE. The BULLISHNESS has evaporated, deal with it.
How I deal with it: full EXIT from my recent SPOT at 4%+ (TP1 was at 11%+), full exit from the whole long-term portfolio BNB. It has been a great ride.
And a short POSITION, using all of my recent SPOT profit as margin.
SHORT at $1083
STOP LOSS: above the 50 MA ($1140 roughly) + above the trendline, 25% stop loss after every 4-hour CANDLE close.
TAKE PROFIT: 33% at $965, 33% at $865, and the rest at $755.
Btw, huge amounts to be LIQUIDATED below $1000, people have aped in not knowing that it was a DEAD CAT.
Brutal, but fair, in my mind.
💙👽
BNBCRYPTOCAP:BNB has established a solid support floor, showing strong resilience against recent market volatility. From the current level, I’m expecting a potential 50% price increase as momentum builds and buyers continue to defend this key zone.

BNB 4H sellBecause the price drop was sharp and its correction has been slow and within an ascending channel, I expect the price to fall toward the specified areas.

Binance Coin (BNB): Smaller Bullish Trend | EMAs Are SecuredBNB is slowly forming a smaller bullish trend — buyers have managed to break above the EMAs and are now working on a clean re-test, which looks like an ideal entry for a long. As long as they manage to hold this structure, we could see another strong leg up toward the upper zones we’ve marked.
Looks healthy so far, just need buyers to keep control over these short-term supports.
Swallow Academy

BNBUSDT.P - October 28, 2025BNBUSDT is consolidating above the ascending trendline support, showing signs of bullish continuation; a breakout above the 1,150 resistance could confirm momentum toward the 1,340–1,374 zone.

BNB — First Bullish Move in Progress ⚡ BNB hasn’t completed its upward move yet.
The first impulse is likely to fill the 1199 – 1272 zone before any correction.
There’s a key box area in this range — don’t forget about the upcoming FED 🇺🇸 and BOJ 🇯🇵 data.

BNB/USDT 1H chart short-term📊 1. Trend structure
• We see an upward channel (black trend lines) - the price rebounds from the lower support line and gradually heads upwards.
• Currently, the rate oscillates in the middle zone of the channel - approx. 1,115 USDT.
• As long as the lower trend line (approx. USDT 1,090) holds, the bullish structure is intact.
⸻
🟩 2. Support and resistance zones
Support:
• 1,106 USDT → local intraday support (already tested several times).
• 1,090 USDT → stronger support + trend line.
• 1,056 USDT and 1,016 USDT → lower zones, in case of a stronger correction.
Resistance:
• 1,125 USDT → local resistance that is currently blocking the upward move.
• 1,148 USDT → another strong resistance, after breaking it, a test of 1,174 USDT (upper border of the channel) is possible.
⸻
📈 3. Indicator – Stochastic RSI
• Currently, the Stoch RSI lines are starting to bounce from bottom to top, after previously entering the oversold zone.
➡️ This is a short-term rebound signal, but not yet a strong buy signal - confirmation of the break through of the ~1,125 USDT level is needed.
⸻
⚙️ 4. Technical scenarios
Bullish:
• Maintaining 1,106–1,090 USDT and breaking above 1,125 USDT → target 1,148 → 1,174 USDT.
• The trend support at 1,090 USDT acts as a buying zone for swing traders.
Bearish:
• A break below 1,090 USDT will negate the channel structure → a possible drop to 1,056 USDT and then 1,016 USDT.
• The RSI will then likely enter a strong oversold zone.

Neutral positionWhat scenario is possible? End of trend or continuation? This is not financial advice!