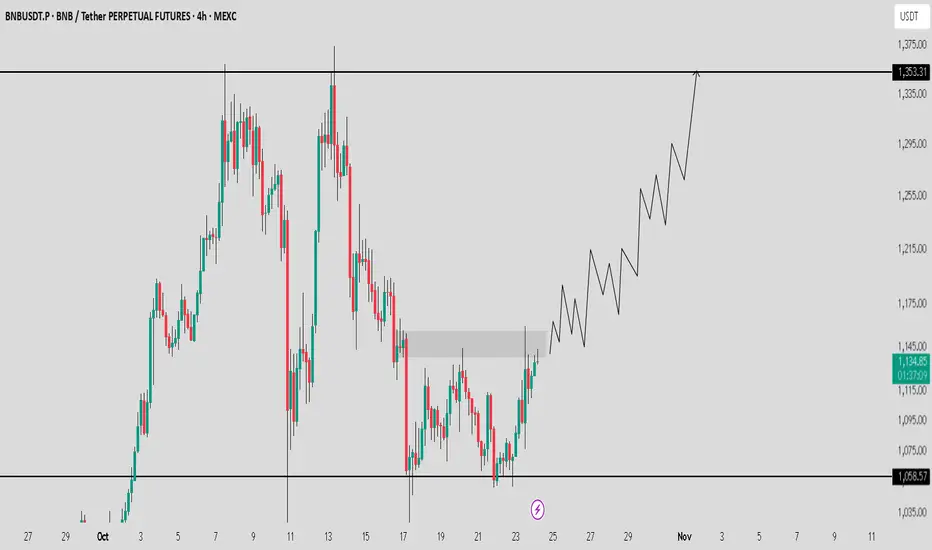
BNBUSDT: Price Rises Up Slowly, Failed To Break The Support!..Hi traders,
BNBUSDT has been ranging up gradually, after it failed to break under the lower zone. there was an assumption of breakdown below this area, based on the chat pattern structure been perceived. As the Bullish range continues, we anticipate $1,312 as potential target.
Meanwhile a breakdown below this support would trigger downside movement.
Like and follow up for more insight on the market.
Thanks for reading.
Trade ideas

BNB / USDT Gearing up for a Bullish move towards $1350BNB is looking strong and showing solid momentum for a move towards $1300 - $1350. Once it clears the key resistance level, we can expect a bullish continuation in the coming days.
Always manage risk wisely and wait for confirmation before entering.
BNB Holds Strong Support — Potential Rebound AheadBNB Holds Strong Support — Potential Rebound Ahead
BNB is currently trading near a strong support zone around 1,065–1,080, which has been tested multiple times in the past. This area has proven to be a key level where buyers tend to step in.
As long as the price remains above this support, a bullish rebound is likely. The first resistance to watch is around 1,140, followed by 1,190 and 1,240 as higher upside targets.
If the support at 1,065 breaks decisively, however, it could signal further downside pressure. But for now, the structure suggests a potential short-term recovery from the current levels.
You may find more details in the chart!
Thank you and Good Luck!
❤️PS: Please support with a like or comment if you find this analysis useful for your trading day❤️

$BNB (DAILY): GOLDEN POCKET retest, TP 1 ($1156) doneMy CRYPTOCAP:BNB spot has hit TP1 at $1156, 11% up from the ENTRY PRICE ($1040, GOLDEN POCKET).
Any profit is good to take in this crap market, #bnb has been stronger than other major coins, so I consider this trade a good one already.
Still higher targets, details from the quoted post still apply for this play.
Remember that this is only a DEAD CAT bounce, don't have your hopes and expectations too high.
Stop loss, basically a DAILY candle close below the GOLDEN Pocket, $1040.
Bullish HIDDEN OBV divergences and a HIDDEN bullish RSI divergence that played out well. All this makes BNB still a bullish asset short-term.
Mid-term I think it's in for a deeper correction after this DEAD CAT is officially complete.
Max target around $1240. Possible shorts from there if bearish divergences occur. Simple approach, no need to overcomplicate trading, at all.
👽💙

BNB the move to 1500$ soon can start As observed and previously outlined in our earlier analysis, we were monitoring the resilience of the critical $1,000 support level. This level, further reinforced by the newly formed ascending channel's support, has demonstrated significant strength by holding firmly. This successful defense against selling pressure indicates a consolidation of bullish momentum. Consequently, the price structure now suggests a high probability of a strong upward move, with our projected targets residing at $1,300 and $1,500.
DISCLAIMER: ((trade based on your own decision))
<<press like👍 if you enjoy💚

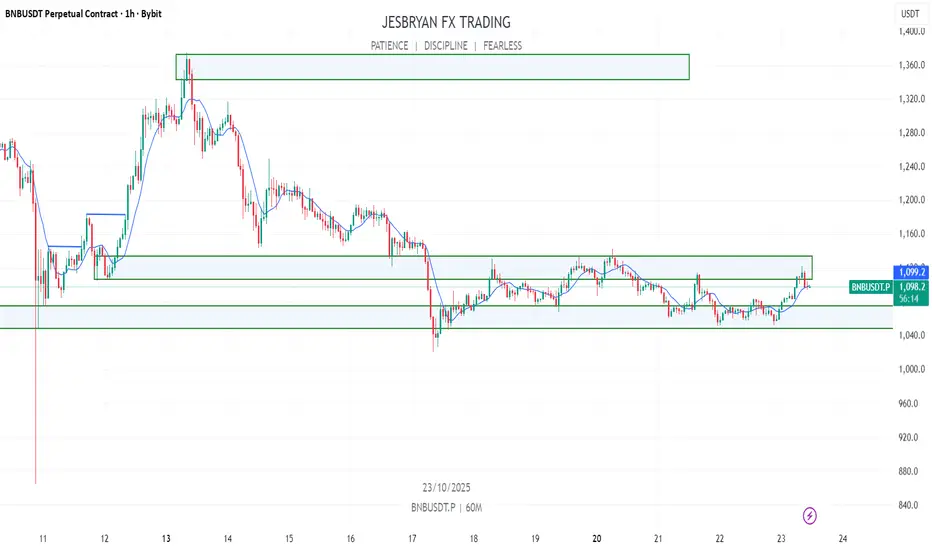
BNBUSDT.P - October 23, 2025The current price action is testing a major 4-hour resistance zone near $1,142.74, which is an ideal entry for a short-sell setup. The target for the short would be to ride the price back down to the recent swing low around the $1,076 support. Plan your trades accordingly; this is an extremely high-risk setup given the major economic and geopolitical announcements expected from President Trump, which could trigger immediate, sharp volatility.

TradeCityPro BNBUSDT Heading Toward a New ATH?👋 Welcome to TradeCityPro Channel!
Let’s dive into the BNB (Binance Coin) analysis — one of the strongest and most bullish charts in the market. Currently, after correcting from its All-Time High (ATH), the price is consolidating within a sideways range, showing that buyers and sellers are in a tug-of-war.
🌐 Overview of Bitcoin
Before we begin, note that we’ve moved the Bitcoin analysis to a dedicated daily report for deeper insights into its market behavior, dominance, and trend structure:
👉 TradeCityPro Bitcoin Daily Analysis
📊 Technical Overview (4H Timeframe)
After facing a heavy rejection from its ATH, BNB once again attempted to retest that level. However, a fake breakout (false move above resistance) led to another sharp correction, pushing the price back down into the range.
Interestingly, this correction bounced exactly from the $1054 support zone, the same level that previously acted as a strong reversal point. This repeated reaction confirms how critical this support is — not only because it aligns with the 50% Fibonacci retracement level, but also due to its importance in the Dow Theory structure as a mid-wave equilibrium.
📈 Long Setup (Bullish Scenario)
If price breaks above $1129, it could trigger an early long position setup — signaling that buyers are regaining control before another major leg up. This move would likely be the early breakout signal ahead of a potential new ATH attempt.
📉 Short Setup (Bearish Scenario)
For short positions, the $1054 level remains the key trigger. A clean breakdown below this zone would indicate the loss of a major support and could open the way for a deeper retracement.
However, keep in mind — this is a high-impact support zone, so avoid placing tight stop-losses or over-leveraged entries. Price volatility is expected to increase around this level.
🎯 Conclusion
BNB remains one of the strongest altcoins structurally, and as long as it holds above the $1050 region, the bullish structure remains valid. The next few sessions will be crucial — watch the $1129 breakout for confirmation of renewed bullish momentum, or the $1054 breakdown for signs of weakness.
📝 Final Thoughts
Stay calm, trade wisely, and let's capture the market's best opportunities!
This analysis reflects our opinions and is not financial advice.

BNB analysis: BYBIT:BNBUSDT.P Price is currently trapped between the support and resistance levels. A breakout above $1150 could push the price toward a new all-time high. The key support is around the $1000 level, and a drop below this would be considered bearish.
BNB 1H ChartCRYPTOCAP:BNB 1H Chart
Forming a Cup & Handle pattern.
Price holding above the FVG 1H zone, watching for a breakout above ~$1.1k
Next target: $1,190 (+7–8%) if momentum continues. 🚀

$BNB 1h Looking hot 🟢 Entry : 1084$ - 1070$
🎯 Tps : 1110$ - 1130$ - 1160$ - 1200$
🔴 Invalidation : 1025$
📌 Do proper money management.. Use low leverage.. DYOR... BINANCE:BNBUSDT.P

BNB rises after calmOn October 10, I watched the BNB 4-hour chart carefully. The market looked unstable, so I decided not to open a position, waiting for confirmation. That choice turned out to be right — a strong drop followed soon after, but previous take-profit levels had already been hit, which protected my balance.
On October 13, I entered on the next candle and closed the first target, taking about 2 percent profit without leverage. Nothing spectacular, but it was more about patience and discipline than chasing big moves. Then, on October 16, the setup repeated itself, but this time the momentum was stronger. All four targets were reached in sequence, giving me roughly 10 percent profit using 2x leverage.
I applied my secret custom strategy that helps analyze market structure without emotions. The indicator clearly highlighted fixation zones and confirmed trend stability. There are thousands of financial indicators on TradingView, but only a few can stay objective during turbulence. That objectivity becomes the true advantage when the market tests every trader’s discipline.
BNNBUSDT Forming Bullish MomentumBNBUSDT is showing signs of strong bullish momentum, forming a classic bullish wave pattern on the chart. This pattern typically indicates the continuation of an upward trend following a period of consolidation. The recent increase in trading volume supports the potential for another bullish leg as buyers continue to accumulate at current price levels. BNB, being a leading asset in the crypto market, often acts as a barometer for overall investor confidence, and the latest structure suggests renewed optimism among traders.
With an expected gain of 50% to 60%+, BNBUSDT could be preparing for a significant upside move if key resistance levels are broken. The formation of higher lows and sustained volume inflows indicate that market participants are positioning for potential breakout opportunities. Technical indicators such as momentum oscillators and moving averages are aligning with this bullish setup, providing further confirmation that BNB may continue to strengthen against USDT.
Investor interest in Binance Coin remains high as the project continues to play a central role in the broader crypto ecosystem. This ongoing engagement from traders and institutions provides fundamental support to the bullish technical outlook. If momentum continues to build, BNB could enter a new phase of price expansion, attracting more attention from both short-term traders and long-term investors.
✅ Show your support by hitting the like button and
✅ Leaving a comment below! (What is You opinion about this Coin)
Your feedback and engagement keep me inspired to share more insightful market analysis with you!
BNBUSDT the double top dump it, now price near critical support The current technical structure presents a clear and critical juncture. Price is now testing a major support zone at the $1,000 level, a decisive point for future direction.
The market's trajectory is now contingent upon the price action at this pivotal support:
Bearish Scenario (Breakdown): A confirmed breakdown and sustained close below the $1,000 support, particularly on elevated volume, would signal a failure of buyer defense. This breach would invalidate the current consolidation structure and likely trigger a significant sell-off. The subsequent measured move projects a decline toward a target range of $600 to $800, representing the next significant area of historical liquidity and support.
Bullish Scenario (Holding & Reversal): Conversely, a strong rejection from this $1,000 zone—evidenced by bullish reversal patterns like a hammer or bullish engulfing candle—would demonstrate robust demand at this key level. This would reaffirm the support's integrity and could catalyze a robust bullish impulse. The initial technical objective would be a retest of the upper boundary of the prevailing trading channel. A decisive breakout above this channel resistance would then open a clear path toward higher targets, beginning with the $1,500 region.
In summary, the $1,000 level is our line in the sand. Traders should monitor price action here closely to gauge the next dominant directional move.
DISCLAIMER: ((trade based on your own decision))
<<press like👍 if you enjoy💚

BNB - SHORT SET-UPBINANCE:BNBUSDT Short Setup
BnB Looking good to short
Entry Between 1257 - 1312
SL Above recent high 1390+
Target Below 1150...
Leverage & Margin as Per Your Risk Capacity

DeGRAM | BNBUSD is under the resistance line📊 Technical Analysis
● BNB/USD continues its decline within a descending structure, repeatedly rejecting resistance near 1,100, signaling sustained bearish control.
● The price remains below key trendlines, and a confirmed breakdown below 1,020 could trigger a move toward the major support area near 960.
💡 Fundamental Analysis
● BNB faces pressure amid regulatory uncertainty around Binance and slower ecosystem growth, while broader crypto risk sentiment remains fragile.
✨ Summary
● Short bias below 1,100; objectives 1,020–960. Technical weakness and regulatory headwinds reinforce the medium-term bearish outlook.
-------------------
Share your opinion in the comments and support the idea with a like. Thanks for your support!

BNB/USDT 1D chart review📊 1️⃣ General context
• BNB price is approximately USDT 1,100, after correction approximately -0.85%.
• It is clear that the market is in a corrective phase after a strong increase - recent highs reached ~1,340 USDT.
• Currently, the rate is balancing between support ~1069 USDT and resistance ~1149 USDT.
⸻
🟢 2️⃣ Supports and resistances (key levels)
• Closest support:
🔸 1069 USDT (short term, red line)
🔸 985 USDT – stronger support (previously tested, below EMA 50)
🔸 884 USDT – strong long-term support (potential correction low)
• Resistances:
🔹 1149 USDT – first level to break
🔹 1226 USDT – important daily resistance
🔹 1344 USDT – main peak, border of the previous impulse
⸻
📈 3️⃣ Moving Averages (SMA/EMA 50/200)
• We see the yellow EMA 50 line and the green SMA 200 line crossed (EMA Cross 50/200).
👉 This is a golden cross - a medium-term growth signal.
• Currently, however, the price has fallen below EMA 50, which means supply pressure in the short term.
• As long as it stays above the 200 SMA (~1060-1070), the macro trend remains bullish.
⸻
📉 4️⃣ MACD
• The histogram is red and decreasing - this confirms that the downward momentum continues but may be weakening.
• The MACD line (blue) is approaching the signal line (orange), which may indicate an impending bounce.
⸻
🪫 5️⃣ RSI
• RSI is around 40-45, which is close to the oversold zone.
• This suggests that sellers may be losing strength and a technical rebound may occur soon.

BNB/USDT | BNB Update – Correction After New ATH!By analyzing the #BNB chart on the weekly timeframe, we can see that after reaching a new all-time high at $1,376, BNB entered a healthy correction phase and is now trading around $1,100. Despite this pullback, the structure remains bullish as long as the price holds above $1,050, which currently acts as the key support zone.
If BNB manages to stay above this level, the uptrend could resume, with potential upside targets at $1,300, $1,400, and $1,550 — consistent with previous projections. However, a confirmed break below $1,050 could open the door for a deeper drop toward the $850 region.
For now, bulls still have control, but the next few days will be crucial to confirm whether this correction is just a pause or the start of a deeper retracement.
Please support me with your likes and comments to motivate me to share more analysis with you and share your opinion about the possible trend of this chart with me !
Best Regards , Arman Shaban

bnb 20 oct 2025 analysisif today 20 oct 2025 daily close we can stand the price above 1111, possibly we can continue rally up

BNB LONG Long BNB at 1,114, aligning with the 1,100–1,125 support zone.
Add if price holds above 1,150, indicating strength toward the 1,200 pivot.
Add again on sustained break/retest above 1,225–1,250.
Take profits at 1350+

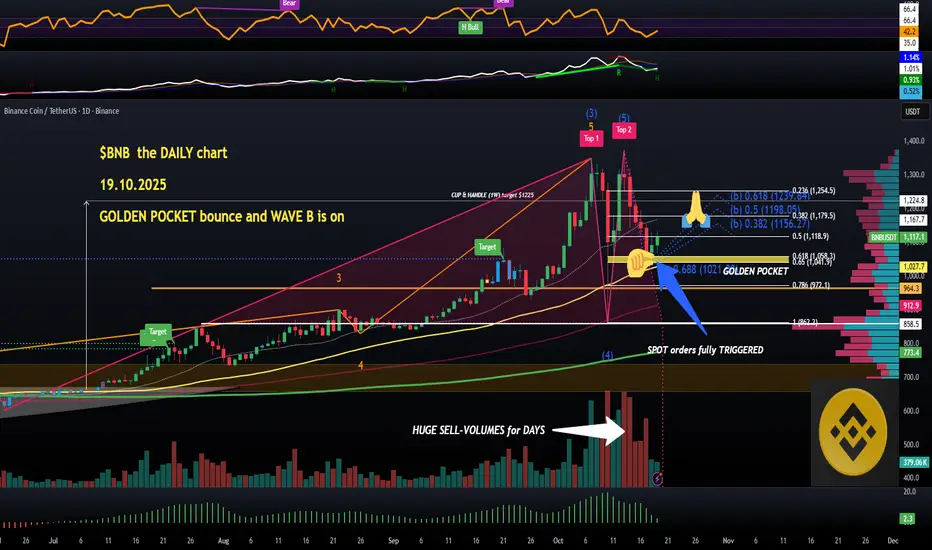
$BNB (DAILY): GOLDEN POCKET bounce, a the WAVE B is ONHappy with my CRYPTOCAP:BNB spot entry 2 days ago in the GOLDEN POCKET. It was such an obvious level for such an obvious and clear ELLIOT'S WAVE count.
I don't often feel fully satisfied with trading, but this trade is pretty text-book for my style that needs confluences.
So, this is basically a DEAD CAT BOUNCE in my opinion, WAVE B, don't ape in, I would say. Volume says one thing, the selling was huge, and stopped for the weekend. Institutions don't do weekends, just saying.
OBV is positive, heavy accumulations, actually, the flash-crash had very little effect. And that's one of the reasons that I'm in this from the GOLDEN POCKET, and watching the reaction at fib 0.5 ($1118).
The fight is on to break above $1118. Once done, $1180 should be next as resistance, then $1250.
Alternatively, one could use WAVE B targets (on the chart).
Rejection at fib 0.5 could easily lead to another $1050 retest.
👽💙
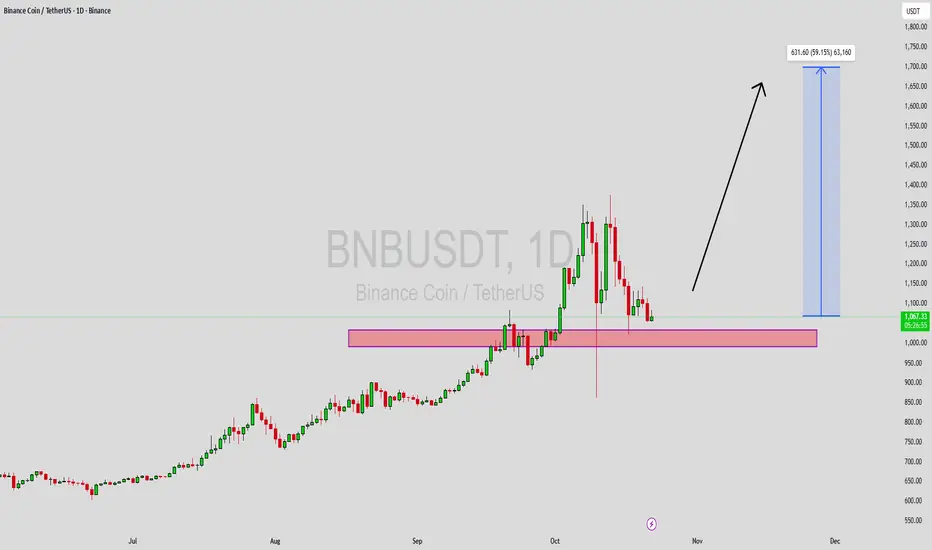
BNBUSDTCRYPTOCAP:BNB has big long momentum. but stoped this level between 1000$ to 1500$. We can buy again if breakout 1100$ and should kept trend above this level.

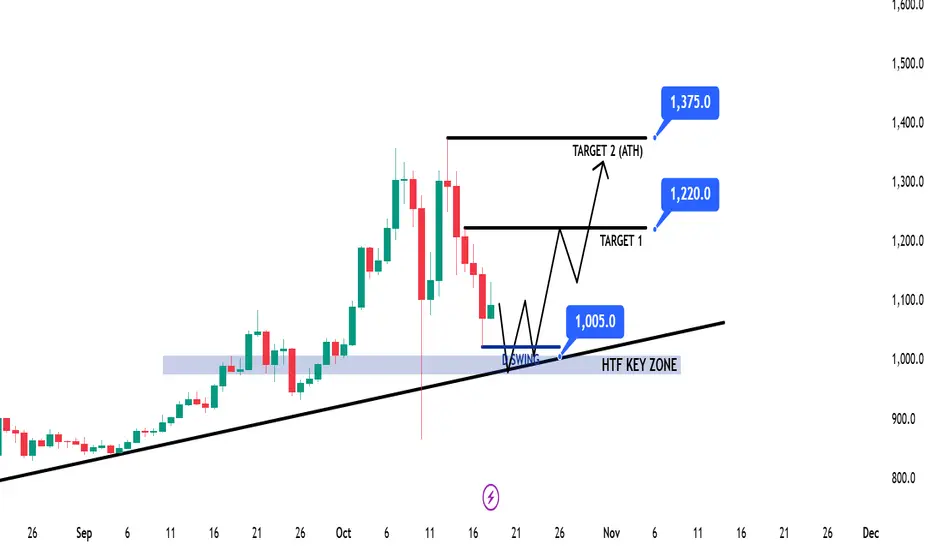
BNB Game Plan - TBKZ ModelBNB Game Plan – TBKZ Model
📊 Market Sentiment
Market sentiment is currently volatile, heavily influenced by U.S. foreign policies.
With the U.S. entering a quantitative easing (QE) phase, the long-term outlook remains bullish, as more liquidity is expected to flow into risk assets.
However, the short-term sentiment is bearish due to renewed trade tensions and Chinese tariff concerns.
Overall, sentiment is slightly bearish short-term, but bullish long-term as macro liquidity expands.
📈 Technical Analysis
Price tapped the HTF bullish trendline and faced a rejection wick during the Chinese tariff announcement.
This reaction confirms the trendline’s significance as a major dynamic support zone.
Now, I’m watching for another price leg toward the HTF trendline, expecting a possible retest and bounce from the HTF Key Zone around $1005.
📘 Model to be used – TBKZ Model (Trendline Bounce at Key Zone)
1️⃣ Identify the HTF trend — trade only in that direction.
2️⃣ Map out the HTF trendline that may act as dynamic support.
3️⃣ Locate the HTF Key Zone containing significant liquidity and structure.
4️⃣ Wait for a bounce and LTF confirmation before entering the position.
📌 Game Plan
I will be waiting for price to return to the HTF trendline and retest the HTF Key Zone near $1005.
Once price gives confirmation (12H–4H structure break), I’ll look for a long setup.
🎯 Setup Trigger
Break of structure on 12H–4H timeframe after testing the $1005 zone.
📋 Trade Management
Stoploss: 12H–4H swing low that breaks structure
Targets: TP1: 1220$ | TP2: 1375$ (ATH)
Move stoploss to breakeven after TP1 hits.
💬 Like, follow, and comment if this breakdown supports your trading! More setups and market insights coming soon — stay connected!
⚠️ Disclaimer: This content is for informational and educational purposes only and does not constitute financial, investment, or trading advice. Always DYOR before making any financial decisions.
BNB SHORTThe wave (3) traveled 162% of the distance, reached the trend line of the structure, and realized the potential of the wave (4) on a logarithmic scale. It's time for correction. Given the momentum formation scenario, this is the best point for a reversal on the chart.
