Letter to my past self- The day I satayed safeThere were times when every major crypto liquidation meant the same thing for me — total destruction.
I used to lose everything.
Five thousand. Thirty thousand.
Even debt on top of the ashes.
Every crash felt like the end of the road, and every comeback felt like starting from zero again.
Today was different.
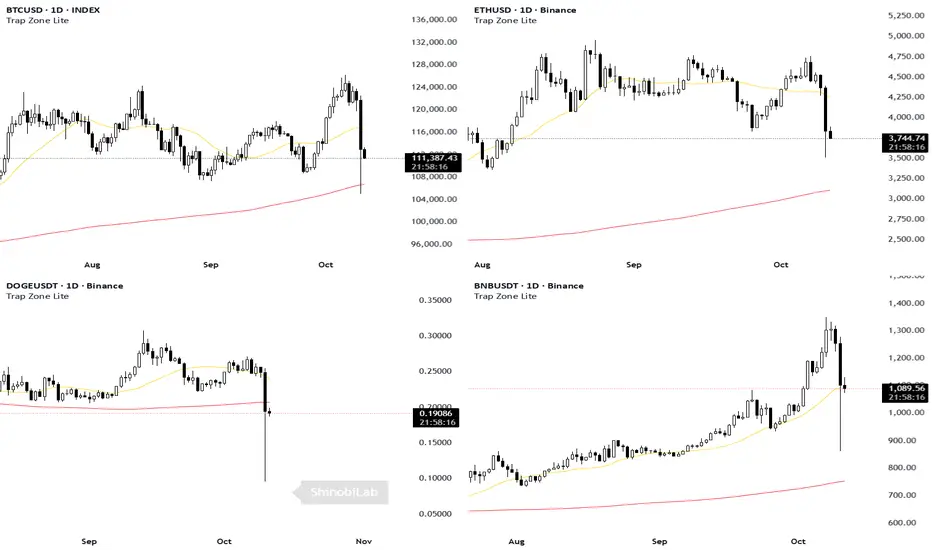
It was the biggest liquidation in crypto history — billions erased —
and for the first time, I’m still here.
Safe. Calm.
Ten green days in a row, plus a new high… what was I expecting?
I knew I had to take profit — I knew it.
I got greedy like a pig.
That’s it.
Not revenge. Not panic. Not doubling down.
Just a clean trade that gave everything back because I didn’t lock the gains.
But I’m still here. And that’s new.
What changed?
I stopped treating Bitcoin like an idol and started treating it like a trade.
I stopped chasing redemption and started honoring my rules.
I stopped trying to win everything back — and began protecting what I already have.
I used to think discipline would kill my edge.
Now I know it’s the only thing keeping me alive.
So, to the old me —
the one who over-leveraged,
who believed every bounce was “the one,”
who measured self-worth by PnL —
thank you for the pain.
It built the version of me who can sit through a liquidation
and only regret not taking profit, not losing control.
This is what growth looks like:
Not more wins.
Just fewer disasters.
“The old me would’ve died in this crash.
The new me just took a breath, accepted the loss, and moved on.”
Trade ideas
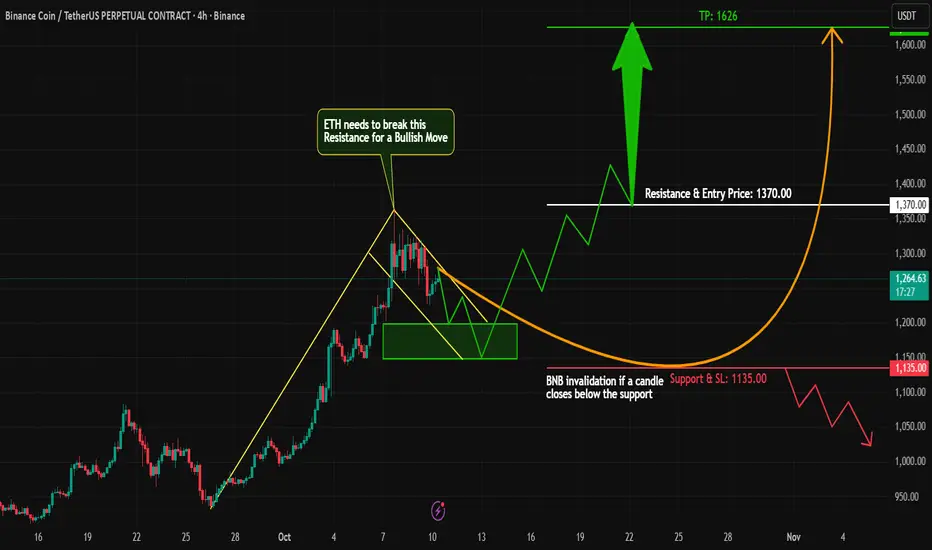
BNB Bullish Flag Formation | Next Move Towards New ATH?#BNB is showing strong bullish momentum — it’s moving in a perfect uptrend with healthy volume supporting the move.
Currently, #BNB is forming a Bullish Flag Pattern on the 4H timeframe, which often signals a continuation of the uptrend after a short consolidation.
Trade Plan:
Wait for a clean breakout above the flag structure.
On breakout confirmation, take a long position with proper risk management.
The breakout could lead us toward a new ATH (All-Time High) if momentum continues.
Key Notes:
Volume confirmation is crucial for a valid breakout.
Watch for fakeouts near resistance levels.
What’s your view on #BNB? Do you think it can reach a new ATH soon?
Let’s discuss!
#BNB #BNBUSD #Crypto #BullishFlag #TradingView #CryptoTrading #Binance #BNBAnalysis #Altcoins #PriceAction #Breakout #TechnicalAnalysis #CryptoBullRun
BNB Daily – Between Resistance and ContinuationBNB Daily – After the Run, Testing Its Range
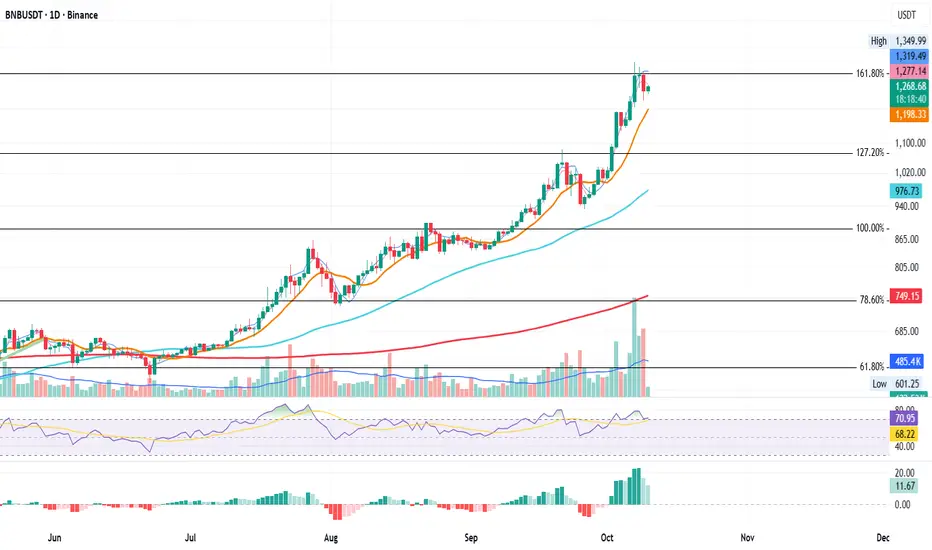
Since July, BNB has delivered an impressive rally. Back then, price was sitting near the 61.8% Fibonacci level, and from there it climbed all the way to a new all-time high at the 161.8% Fib extension, which is now acting as resistance.
On October 7 and 8, intraday moves briefly pushed above this level, but both sessions failed to close above it, leading to a clear rejection on October 9, confirmed by a large downside volume bar.
From a system perspective, the structure remains in an uptrend, with MLR > SMA > Price > BBc
indicating that despite the pullback, the broader bullish structure is still valid.
Key levels to watch:
Resistance: 161.8% Fib at $1310
Support: BB Center (orange) at $1198
If BNB can hold above the BB Center, it keeps the upper hand and could attempt another move toward its ATH.
However, a daily close below the BB Center would shift the short-term momentum bearish, opening room for further downside.
Periods like this often decide whether a move becomes continuation or distribution: patience around key levels pays off.
Bias:
Neutral-bullish — uptrend intact, but watching the BB Center closely for confirmation.
Always take profits and manage risk.
Interaction is welcome.
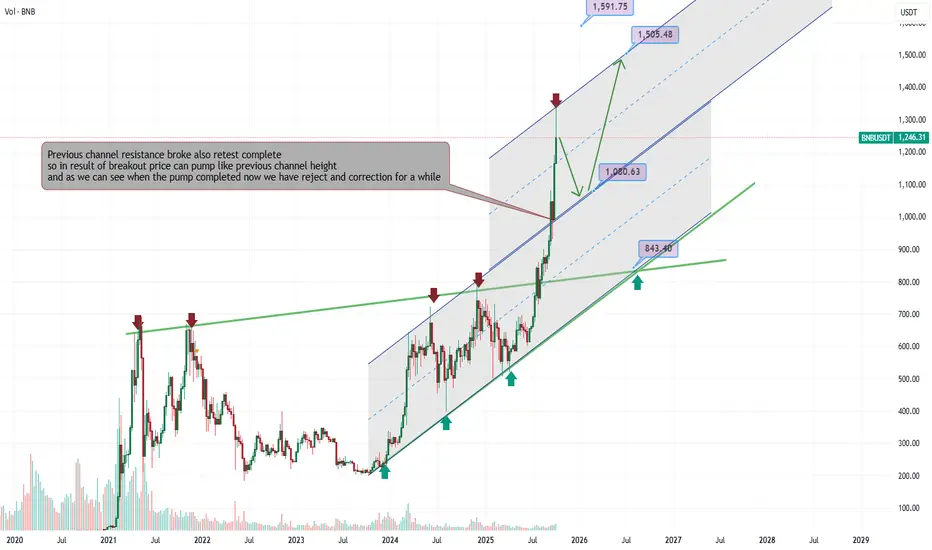
BNB hit the ATH and now can dump to 1000$Previous channel resistance broke also retest complete so in result of breakout price can pump like previous channel height and it hit ATH exactly at that point which we expect.
and as we can see when the pump completed now we have reject and correction for a while is ahead also major support and available one is near 1050$ and it would be previous channel resistance which can be now new channel support after a valid retest.
if the support hold we can expect ATH 1500$ else we can expect 850$.
DISCLAIMER: ((trade based on your own decision))
<<press like👍 if you enjoy💚
Perfect Sync: V Reversal Meets Bull Flag
Two clean and classic technical structures:
✅ V-Reversal Formation
✅ Bull Flag – still active and building pressure
After a sharp reversal, the price entered a bullish continuation phase.
Currently moving within the flag structure toward its upper edge.
If we see a breakout to the upside, the move could match the flagpole length, which aligns well with the target from the V-reversal pattern.
📍 Bullish scenario remains valid as long as we stay within structure.
📉 Breakdown below $570 invalidates this setup.
🧠 Important Reminder:
Enter only after a confirmed breakout.
✅ Apply strict risk management
✅ Never risk more than 1% of your capital on a single position.
Everything’s clear. No noise. Just wait for confirmation — let the market come to you.

BNB; ATHHello friends
Given the recent growth we have had, the price has formed a double top pattern and is in the specified support areas, we can expect the price to be supported until the specified targets.
*Trade safely with us*

BNB Pullback May Reset Before $1,550 PushBINANCE:BNBUSDT has cooled about 3.4% from its new all-time high near $1,340, but the structure still favors bulls. On the 12-hour chart, BINANCE:BNBUSDT is replaying a bullish flag fractal that led to past 28% rallies. The price has built a “pole” from around $840 to $1,340 and now seems to be forming the “flag” — a short-term consolidation before another breakout.
A bearish RSI divergence supports a temporary pullback. While price made a higher high, the RSI printed a lower high, signaling slowing momentum. Based on past behavior, a 13%–14% correction toward the $1,190–$1,130 zone would fit the same pattern and complete the flag setup. This region also aligns with key Fibonacci supports.
On-chain data adds to the cooldown case. The short-term holder NUPL has surged 170% since late September, showing traders sitting on high unrealized gains — a typical local top signal. If bulls defend the support range, the next Fibonacci targets remain $1,550 and $1,820. The trend stays constructive unless BINANCE:BNBUSDT closes below $1,130.

Can BNB hit 12% upside and reach $1,455 soon?Hello✌️
Let’s analyze Binance Coin’s price action both technically and fundamentally 📈.
🔍Fundamental analysis:
BNB Chain is stepping up faster blocks, lower supply, and new support for DeFi, AI, and RWA builders. These moves could make BNB more useful and rarer over time. 🚀
📊Technical analysis:
BINANCE:BNBUSDT is showing robust fundamentals and exceptional trading volume, supporting strength beyond pure technical. If key support levels hold, a further 12% upside toward $1,455 is plausible. 📈🚀
📈Using My Analysis to Open Your Position:
You can use my fundamental and technical insights along with the chart. The red and green arrows on the left help you set entry, take-profit, and stop-loss levels, serving as clear signals for your trades.⚡️ Also, please review the TradingView disclaimer carefully.🛡
✨We put love into every post!
Your support inspires us 💛 Drop a comment we’d love to hear from you! Thanks, Mad Whale

Binance Coin Positioned For 16% Upside Toward $1,280 TargetHello✌️
Let’s analyze Binance Coin’s price action both technically and fundamentally 📈.
🔍Fundamental analysis:
BNB burns have cut supply ~30% since 2017, while big holders like BNB Network Company push demand. Less supply and concentrated buying could boost price, as past burns often led to big rallies.
📊Technical analysis:
BINANCE:BNBUSDT has precisely reached its previous target and is trading within a rising channel, now approaching the upper boundary; a breakout could trigger a 16% rally toward $1,280.
📈Using My Analysis to Open Your Position:
You can use my fundamental and technical insights along with the chart. The red and green arrows on the left help you set entry, take-profit, and stop-loss levels, serving as clear signals for your trades.⚡️ Also, please review the TradingView disclaimer carefully.🛡
✨We put love into every post!
Your support inspires us 💛 Drop a comment we’d love to hear from you! Thanks, Mad Whale

$BNB Technical Outlook!CRYPTOCAP:BNB Technical Outlook
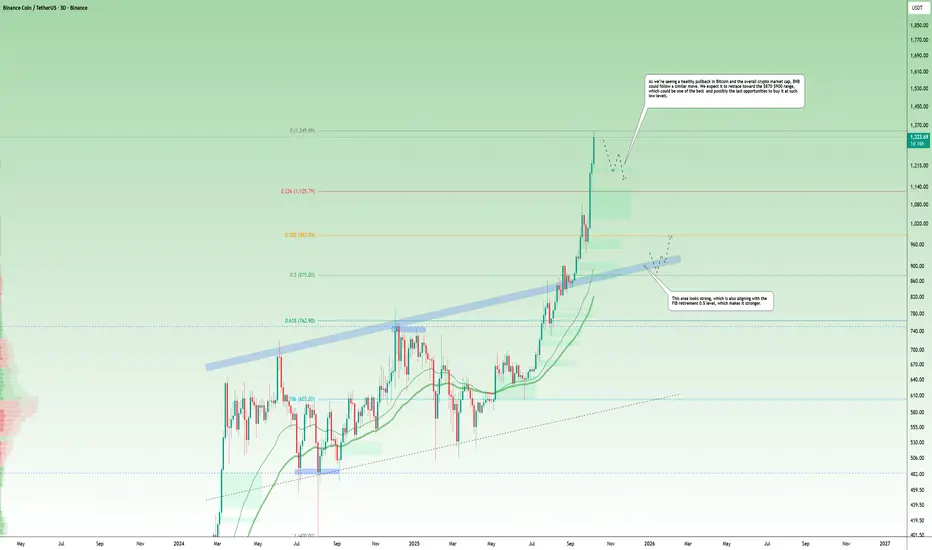
BNB continues to mirror Bitcoin’s strength, extending its rally above the 1.3K level. After such an explosive move, a healthy pullback seems likely before the next leg higher.
The chart shows confluence around the $870–$950 zone, aligning with the 0.5 Fibonacci retracement and prior structural breakout area, a potential region for re-accumulation if tested.
As long as BNB holds above the 0.618 zone near $760, the broader trend remains bullish with upside targets toward $1,500–$1,800 over the next swing phase.
Watch for retracements into support rather than chasing highs dips could offer the last accumulation opportunity before the next major expansion.
Bnb/Usdt - Support Bounce And Weak High Target Current price shows a bullish trading setup for Binance Coin (BNB/USDT) on the 15-minute timeframe. The price forms a CHoCH (Change of Character) and crosses above the EMAs, signaling a possible trend reversal. The suggested entry is at the point where the CHoCH and EMA intersect, with a target price set at 1340. The setup is supported by a bounce from a strong support zone, aiming for a move toward the weak high area.

Trades for today Tuesday 10/7 BNB shortTrades for today Tuesday 10/7 BNB short Using PAR LTF momentum shift and pivots

BNB/USDTWhat CRYPTOCAP:BNB is doing right now is a preview of what most altcoins will do soon. It’s printing new all-time highs one after another. The three targets are already marked above, and honestly, it can easily pump to the third target like it’s nothing.

BNB/USDT: Bullish Breakout from H&S and Pennant FormationHi guys!
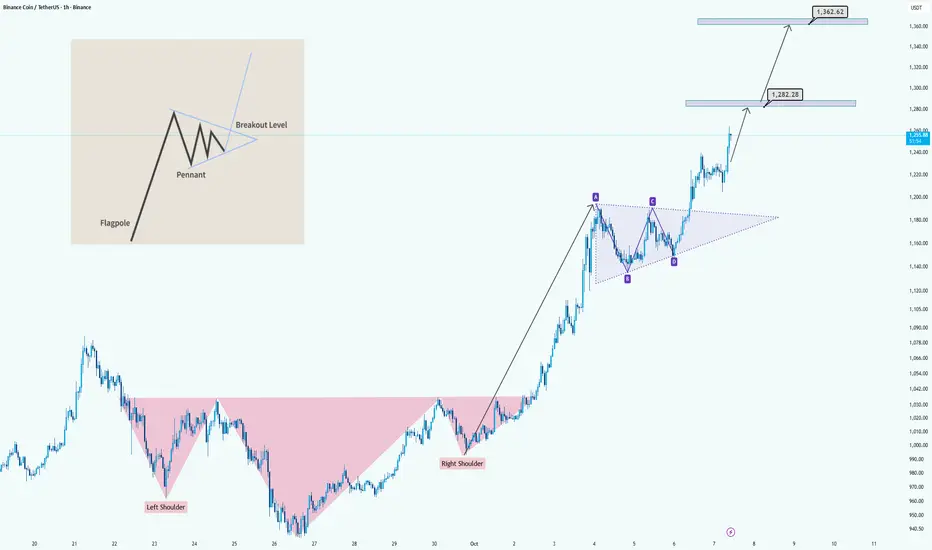
The chart clearly shows a bullish structure forming after a strong upward move. Initially, the price completed an Inverse Head and Shoulders pattern , signaling a potential trend reversal from bearish to bullish. After the breakout above the neckline, the market continued to climb and started consolidating into a bullish pennant pattern , a continuation setup that typically follows a sharp rally (flagpole).
The pennant breakout confirms renewed bullish momentum, suggesting the next leg higher is underway. Based on the flagpole projection, the measured targets are around $1,282 for the first resistance zone and $1,362 as the extended upside target.
In summary:
Patterns identified: Inverse Head and Shoulders + Bullish Pennant
Trend direction: Bullish continuation
Targets: $1,282 and $1,362
Outlook: Positive as long as price holds above the pennant breakout level
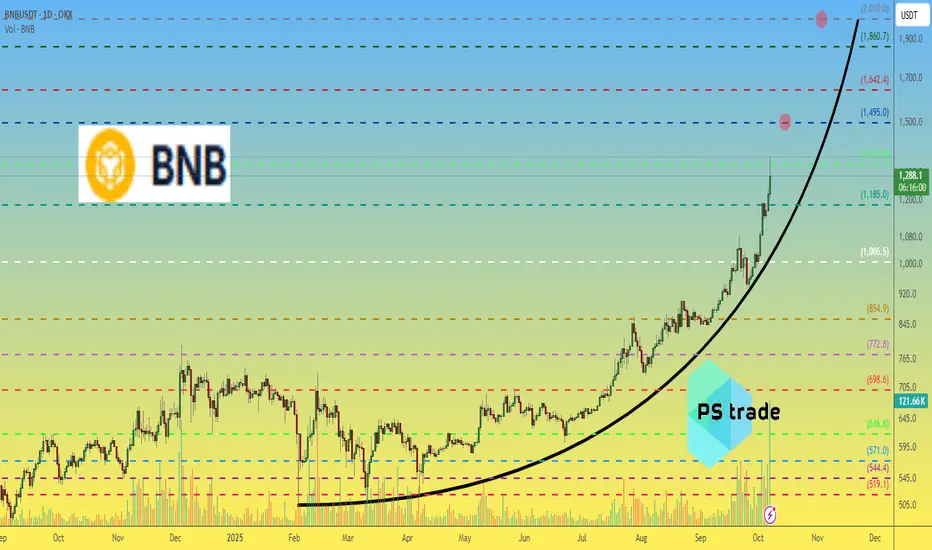
BNB price analysis🔥 CZ really knows how to launch candles to the sky — and this parabolic move feels like a true “comeback celebration”! 💥
💧 Even liquidity from CRYPTOCAP:ETH is now flowing into CRYPTOCAP:BNB — everyone’s trying to catch the wave.
Honestly, we wouldn’t be surprised if the goal is to “push” OKX:BNBUSDT to a clean $1500, that’s 2× from the previous ATH 🚀
But let’s be real — you don’t need to be a pro trader to see it:
the further price flies away from an already dangerous parabolic growth, the riskier new entries become ⚠️
😌 Ah… remember when CRYPTOCAP:BNB was $0.5 or even $5?
📊 P.S:
Chart levels are reacting quite well — a decent reference point for orientation.
🤔 What do you think — will CRYPTOCAP:BNB hit $1500 or even $2000, or is this already too much euphoria?
______________
◆ Follow us ❤️ for daily crypto insights & updates!
🚀 Don’t miss out on important market moves
🧠 DYOR | This is not financial advice, just thinking out loud
BNB Update📊 BNB Update
BNB is retracing now 🔄
If it keeps retracing to the green zone level 🟢, there’s potential to enter a long position — with confirmation ✅

Long trade 📘 Trade Journal Entry
Pair: BNB/USDT.P (Perpetual Contract)
Date: Sat 4th Oct 25
Time: 12.00 pm
Session: London to NY Session AM
Direction: Buyside Trade
Timeframe: 1H
🔹 Trade Details
Entry: 1143.70
Profit Target: 1312.09 (+14.72%)
Stop Loss: 1135.18 (–0.74%)
Risk-Reward Ratio (RR): 19.76
🔹 Technical Context
Structure: The setup formed during an ascending structure breakout after a period of EMA compression and FVG rebalancing.
1Hr TF overview
Confluences:
50 EMA and 200 WMA slope alignment showing strong bullish momentum.
Series of Fair Value Gaps (FVGs) beneath current price confirming institutional footprints and demand zones.
Fib retracement support from 0.382–0.618 providing structural confluence for entry.
Strong volume confirmation during breakout, validating buyer dominance.
Higher timeframe projection targeting 1.618–2.618 extensions.
Stop placement: Protected below the 1135 liquidity pocket and 50 EMA boundary.
Targeting: Extended projection zones 1.618–3.618 aligning with previous imbalance at 1310–1320s.
🔹 Trade Narrative
BNB/USDT.P exhibited a clean bullish continuation into the weekend cycle, driven by volume expansion and sustained EMA confluence. The entry at 1143.70 capitalised on the London-to-NY session transition, using deep liquidity rebalancing within an established uptrend.
Price respected multiple FVGs as re-entry levels, maintaining clear displacement with minimal drawdown. The setup demonstrated institutional precision, confirming strong trend conviction aiming for 1312 target levels.

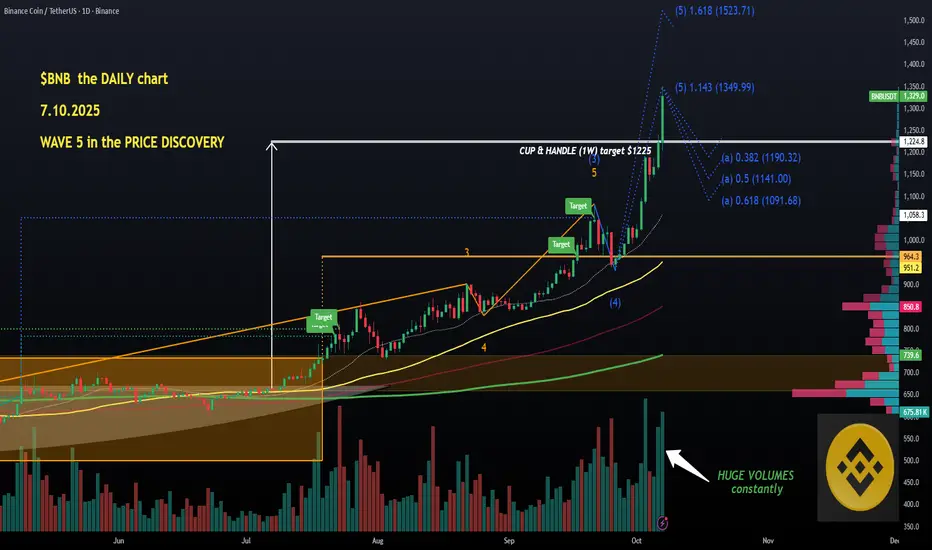
$BNB in PRICE DISCOVERY, my potential BUY-THE-DIP levelsCRYPTOCAP:BNB keeps smashing bears on a daily basis, I was considering a SHORT yesterday due to overbought RSI on all timeframes combined with BEAR divergences on some.
I obviously didn't pull the trigger due to the rising volumes (and OPEN INTEREST mooning). Good decision, as it turns out.
So, WAVE 5, these can overextend beyond imagination, and the next target based on Elliot's Wave Count would be at 1.618 Fib extension - $1523.
Taking profits there makes a lot of sense especially if the #Binance coin keeps going vertically without a correction.
Buy-the-dip levels are right there on my DAILY chart, the three most likely retracement are as follows (WAVE A: corrective wave):
- fib 0.382 ($1190)
- fib 0.5 ($1141)
- fib 0.618 ($1092)
We will get a brutal correction at some point, and BNB is going to keep outperforming other top coins, already bigger than CRYPTOCAP:XRP in terms of marketcap.
For now, let is continue melting faces, and I will continue hunting for entries in its ecosystem. SEED_DONKEYDAN_MARKET_CAP:FLOKI long in-play, a few other ones on my watchlist👽💙
BNBUSDT — Bullish consolidation ahead of resumed uptrendThe bullish consolidation in BNBUSDT that I’ve been watching has begun to resolve in the market’s favor. Price action is coiling after two consecutive white spinning-top candles, a pattern that signals indecision but also a readiness to resume the prior trend when confirmed. The move has occurred on heavier volume concentrated in the current price area, and the pair sits roughly halfway between two key Fibonacci retracement levels — a location that commonly precedes a corrective bounce rather than a full trend reversal. Trend Strength sits just above zero, suggesting a fragile bullish bias rather than conviction.
Viewed on a slightly wider timeframe, BNBUSDT is grinding inside a shallow range that resembles a consolidation brick; the path of least resistance still leans toward the upside provided the short-term structure holds. Conventionally, the presence of consecutive indecisive candles on increased volume near mid-Fibonacci territory combined with a mildly positive momentum indicator favors a corrective rebound rather than an extended sell-off.
Key short-term levels to monitor on the way up are the 38.2% Fibonacci retracement as the likeliest target for the initial bounce, with a secondary cap at the 50% retracement if buyers show enough follow-through. Beyond those, a return toward prior highs remains plausible, though that area will present a zone of elevated resistance and will need clear volume-backed breakout confirmation to be trusted.
RSI and other momentum readings are consistent with a measured recovery rather than an impulsive surge, so expect the move to unfold over the coming 2–3 weeks. If the market fails to sustain above the 38.2% level and momentum turns down, the alternate scenario would be a continuation of the consolidation or a deeper retracement toward the lower Fibonacci boundary.
Short summary:
Setup : consolidation with two white spinning-top candles, heavier volume locally, price midway between two Fibonacci levels, Trend Strength slightly > 0.
Base case : corrective bounce to 38.2% (primary) — up to 50% (maximum) — then continuation higher toward prior highs (resistance zone).
Timeframe : ~2–3 weeks.

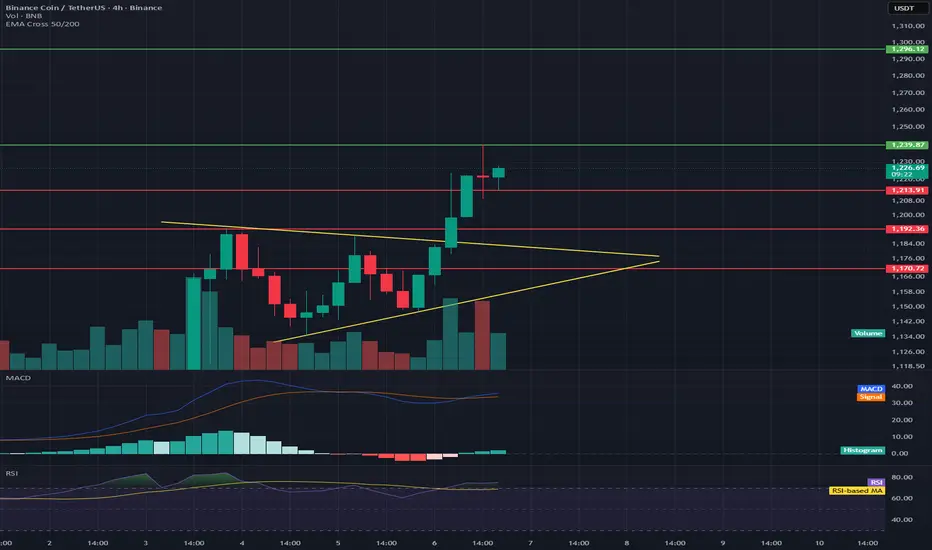
BNB/USDT 4H Chart Review📊 Market Structure
The chart shows a symmetrical triangle (yellow lines) from which a breakout occurred upwards—a classic signal of a continuing uptrend.
The price has broken above resistance at ~$1,210, which now acts as local support.
Current price: ~$1,226, following a dynamic breakout from the triangle.
📈 Key Levels
Support:
$1,210 — Retest after the breakout (important defensive level for bulls)
$1,193 — Previous local support in the triangle
$1,170 — Stronger support and lower boundary of the previous consolidation
Resistance:
$1,239 — Local resistance that has already been tested
$1,260–$1,265 — Next target upon breakout (equal movement or measuring the height of the triangle)
$1,300 — Psychological and technical resistance level
📊 Volume
The breakout was confirmed by a significant increase in volume, lending it credibility.
No sharp drop in volume after the breakout — the market remains in demand.
⚙️ MACD
The MACD is above the signal line and rising, confirming a bullish impulse.
The histogram is positive, but not excessively broad → momentum is healthy, but not overheated.
💪 RSI
RSI: ~75, which is slightly in the overbought zone.
It's worth watching for a short-term correction or retest of the $1,210 level before the uptrend becomes more established.
BNB/USDT | BNB Smashes $1200 Target – Momentum Remains Strong!By analyzing the BNB (Binance Coin) chart on the weekly timeframe, we can see that the price continued its bullish rally exactly as expected, breaking multiple new all-time highs (ATHs) and hitting the $1200 target.
It’s now trading around $1220, and the previous analysis remains valid. The next upside targets are $1400 and $1550, while the main support and demand zone lies between $980–$1050.
This setup has delivered over 30% profit so far — hope you made the most of it!
Please support me with your likes and comments to motivate me to share more analysis with you and share your opinion about the possible trend of this chart with me !
Best Regards , Arman Shaban

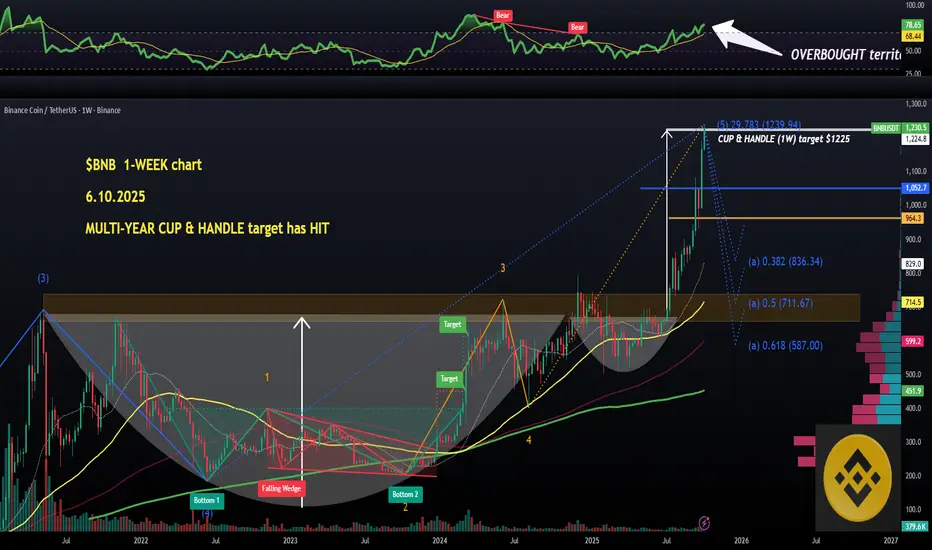
$BNB (weekly): multi-year CUP & HANDLE has just hit its TARGET Yeah, CRYPTOCAP:BNB has been on an absolute rampage for three months now. Thinking of apeing into it? Perhaps you should have a look at the WEEKLY chart first.
On 21 September I dropped the weekly timeframe analysis, talking about a 4-years old gigantic CUP & HANDLE pattern and based on that I gave a projected target of $1225.
Guess what, it has been HIT today.
That C&H pattern is a thing of beauty and will be featured in text-books soon.
Picture-perfect.
What now. Definitely no longs for me. If anything, I'm tempted to try a small-sized SHORT due to overbought RSI (78.5), and many BEAR RSI divergences on shorter timeframes (next posts of mine for these analyses).
Not opened a position YET, I need a bit more time to think.
What I am going to say is, be cautious with LONGS and even SPOT buys. It is just too oversold and too vertical👽💙
BNB To Cool Off?Since we talked about BNB in the intro, I thought I would take a quick look at the chart… I think this is clearly a bullish asset, so I would be looking for a nice dip to buy if the opportunity arises. If not, cest la vie.
We have overbought bearish divergence on the daily, and on multiple time frames below. If this week closes lower, we could also see it on the weekly.
This could easily drop 20% and still look quiet bullish. Anything below $1,000 would be a gift, assuming we believe the bull market is continuing.
