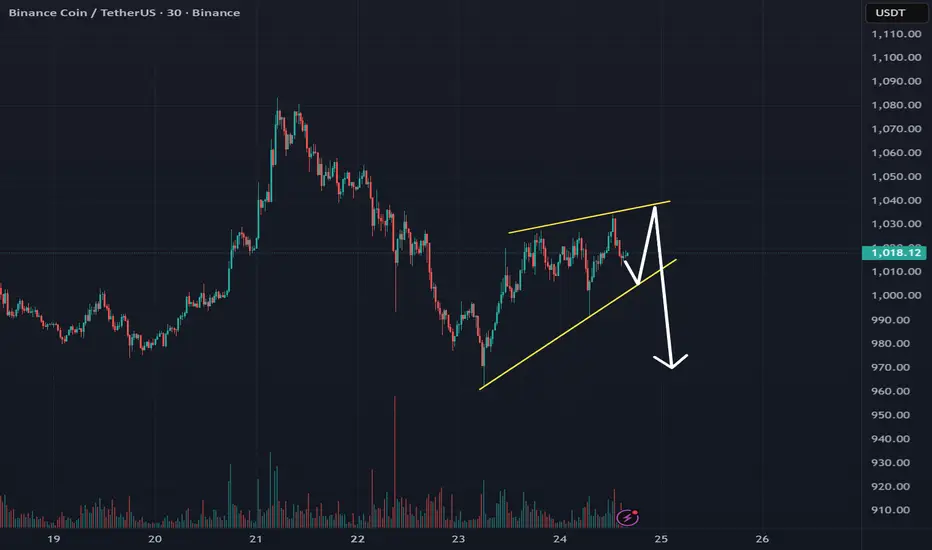
Binance Coin (BNB): Similar Pattern Forming / Liquidity HuntingBNB coin has pretty similar price ation compared to Novemenr 2024 bullish buildup we had. Lately price has been rather trading in a sideways chanel with quite some liqudiity huntings on the way as well.
What we are expecting currently is a further buyside dominance which would lead the price to local high area, from where we might be seeing some strong downard movement and from wher ewe will be trying to catch a short position as well.
P.S. not our favourite coin to trade but scalping is pretty decent on this one tbh.
Swallow Academy
BNBUST.P trade ideas

BNB Breakout Play – Eyeing the Next Wave📊 Current Setup
BNB surprised the market at the start of the week. Instead of continuing its downward channel and making that next leg down, price broke out above the channel — a strong bullish signal. This breakout shows that sellers lost momentum, and bulls are starting to take the driver’s seat 🐂⚡.
Right now, after such a push, we’re seeing the market cooling off — a natural correction phase after a bullish impulse. This correction isn’t weakness, it’s just the market recharging for the next wave.
🚦 Trading Plan
👉 I’m watching the $950 support area as a prime entry zone 🌴. If price pulls back there and shows signs of holding, that’s the beach where bulls can reload.
👉 Target: Riding the wave up toward $1,075 🎯. That’s the level where profit-taking makes sense as it lines up with previous structure.
👉 Stop-loss: Tucked around $925 🛑 to stay safe in case the setup fails.
🧭 My Take
The breakout from the downward channel flipped the vibe on BNB. Short-term corrections are healthy, and I see the $950 zone as a solid opportunity to step in for the next run. The risk is defined, the reward is solid, and the trend shift adds weight to the bullish case.
This is less about chasing green candles and more about waiting for the chart to reset — patience now sets up a cleaner ride later 🌊🚀.
💬 What do you think about this scenario? Only share your idea if you’ve got another opinion — otherwise just hit that button 👍

BNB Swing Long Idea - TTKZ Model📊 Market Sentiment
FED has resumed its rate-cutting cycle, starting with a 0.25% cut in September, with two more 0.25% cuts expected in the coming months. Additionally, institutional liquidity inflows have accelerated as the U.S. officially adopts crypto as part of its reserves. While inflation remains elevated, the weakening labor market is forcing the FED to ease, driving more capital into risk-on assets.
📈 Technical Analysis
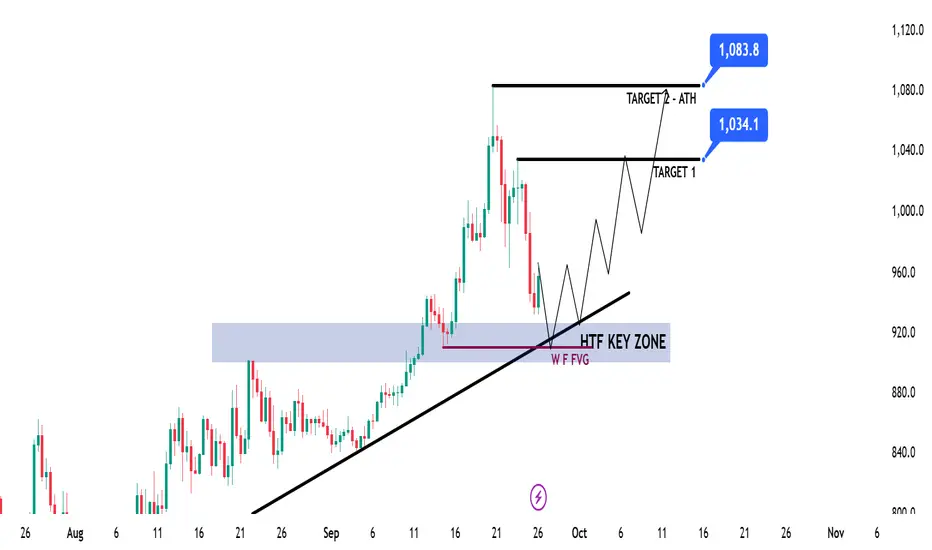
Price is making new all-time highs continuously. The HTF Weekly–Daily structure remains bullish, so my bias is only long.
Currently, price is retracing toward the HTF bullish trendline and a HTF Key Zone, both of which I assume are strong levels for a potential bounce and continuation higher.
📘 Model to be used – Trendline Test w HTF Key Zone (TTKZ)
In this model, I look for a clear HTF trendline that continuously supports price. When price comes back to test that line, I check if there’s also a HTF Key Zone aligned for confluence. Strong overlapping zones create higher probability bounce areas for long setups.
📌 Game Plan
1-Wait for a test of the HTF trendline
2-Confirm test of the HTF Key Zone
🎯 Setup Trigger
I will be waiting for a 4H break of structure before entering the trade.
📋 Trade Management
Stoploss: Below the 4H swing low that creates the break of structure
Targets: TP1: 1034$ | TP2: 1083$
Once TP1 is reached, stoploss will be moved to breakeven.
💬 Like, follow, and comment if this breakdown supports your trading! More setups and market insights coming soon — stay connected!
⚠️ Disclaimer: This content is for informational and educational purposes only and does not constitute financial, investment, or trading advice. Always DYOR before making any financial decisions.
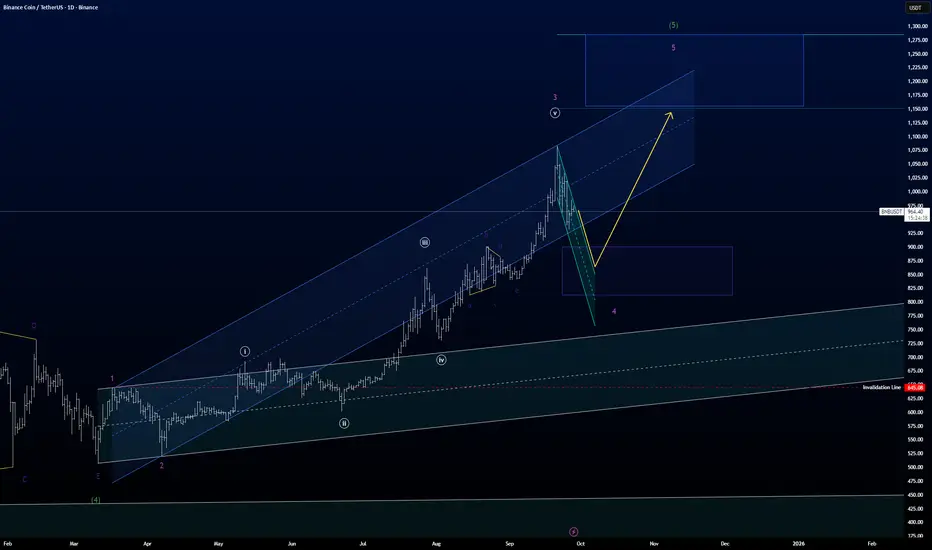
BNB does not completely obey, what BTC commands..In a count I did yesterday I wrote about BTC has started the decent, but from what I can see here, I still believe BNB need a little push up before going into a correction of a higher degree.
Right now BNB is in what I count to be purple wave 4.
And there is a chance purple wave 4 has already finished, and we therefor have started the move up in purple wave 5.
One of the guidelines in Kennedy channeling technique, which is a powerful tool in counting Elliott Waves, is that price has not completed wave 4 before tagging the bottom of the acceleration channel. (the blue channel).
Another guideline in Elliott Wave is that wave 4 often retraces down into wave 4 of the previous lower degree. (This area I have marked in the Purple box)
Therefor we could have a little downside left before starting the purple wave 5.
Being optimistic purple wave 4 is done, since I can count an simple zig-zig correction.
A confirmation of wave 4 is done and the purple wave 5 has started, is to wait for price to break the deceleration channel. (the green channel.)
But in either case, I believe BNB still has a wave 5 to finish before the correction down in a higher degree.
BNB 1H Analysis - Key Triggers Ahead😃 Hey , how's it going ? Come over here — Satoshi got something for you!
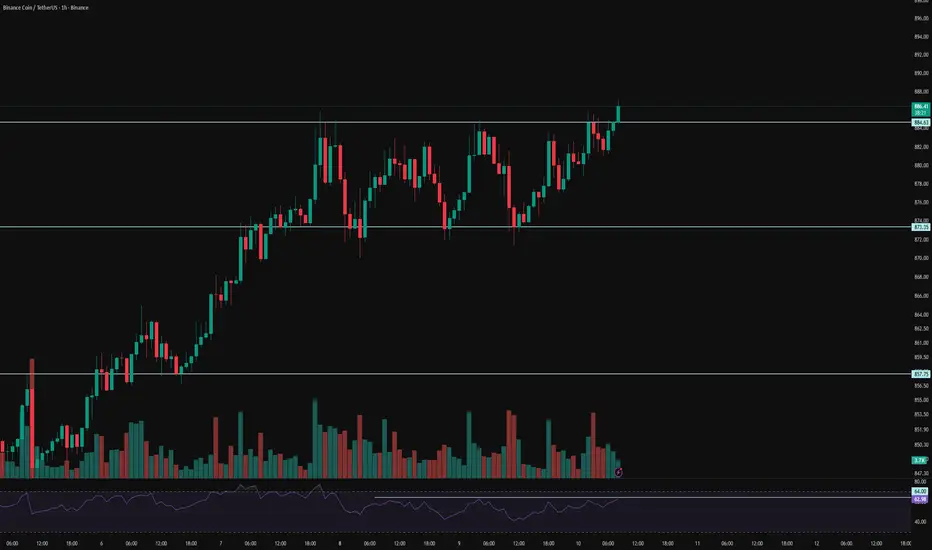
⏰ We’re analyzing BNB on the 1-Hour timeframe.
👀 On the 1-hour timeframe of Binance Coin we can see that this coin, the popular token of Binance exchange with very strong backing, has formed a very important resistance at $885. With a breakout and confirmation above this level, and if the PPI news is positive, BNB could start another strong upward move.
⚙️ The key RSI level for this coin is at 64, and breaking above this level could give BNB higher volatility and even a price surge.
🕯 The volume, size, and number of green candles are increasing, and it seems we are almost exiting the range structure. With buying pressure and rising volatility, BNB could form more green candles and experience solid price growth.
🌒 On the 1-hour timeframe of the BNBBTC pair we can see that it has been rejected from the 0.007915 zone, which has created a trigger for a breakout at this level. If this zone is broken, BNB could also break its marked resistance in the USDT pair and move upward.
💡 This coin had resistance at $885, which has now been broken, and it is moving upward. A pullback to this resistance also happened during this breakout, which was executed well. For confirmation, you can also check the 15-minute timeframe.
❤️ Disclaimer : This analysis is purely based on my personal opinion and I only trade if the stated triggers are activated .
Volatility"No matter what kind of math you use, you wind up measuring volatility with your gut" - Ed Seykota
@TrendTrades

BNB 15-Minute Chart Shows Bearish Wedge PatternBNB is forming a bearish wedge pattern on the 15-minute chart
This pattern is bearish and formed within the boundaries of a global bearish flag pattern
Current price: $1016
According to the movement within the local wedge, a downward breakout is expected.
The price may reach $1000 and below
Within the pattern, false breakouts to $1050 are possible
---
More detailed analysis, additional charts, and key levels to watch are available on our website
BNB - short in a case of a BULL trapBNB - short in a case of a BULL trap
Coin alreadyy did 100% rise
also Oi started dropping that;s often a signal for range creation or a pullback

BNB LONG TARGET 1009 Watch for dip fills 967 → 955. Expect BNB to hit 1009 magnet soon after entry, with potential extension to 1020–1025 into next session.

BNB long back to $1055Opened a new long position on bnb a while ago
Aiming for $1055
Sl: 1005
Roughly 2 RR

BNB/USDT | BNB Bull Run Continues – No Signs of Correction Yet!By analyzing the Binance Coin (BNB) chart on the weekly (logarithmic) timeframe, we can see that the price has set a new ATH above $1,000. Since the last time I analyzed BNB — over 2 years ago — the price has increased by more than 400%!
Currently, BNB is trading around $1,060, and there are still no signs of a correction on the chart. With the current momentum, I expect further growth, possibly pushing the price to levels above $1,200. This analysis will be updated again!
Please support me with your likes and comments to motivate me to share more analysis with you and share your opinion about the possible trend of this chart with me !
Best Regards , Arman Shaban

BNB/USDT – Ascending Triangle Breakout Setuphi traders
The BNB/USDT chart is displaying a classic ascending triangle pattern, which typically signals a potential bullish breakout. This pattern has formed over the past year, characterized by a series of higher lows (shown by the rising red trendline) while repeatedly testing a strong horizontal resistance zone around $690–$730 (highlighted in green).
BNB is currently trading near the upper resistance boundary at $692.85, showing signs of bullish momentum. A successful breakout above the $730 resistance level could confirm the ascending triangle breakout and trigger a strong upside move.
Target & Potential Move:
Breakout target: ~ $950 - $1,000
Measured move: 40% from the breakout point, aligning with the height of the triangle
Summary:
Pattern: Ascending Triangle (bullish)
Breakout Confirmation Level: $730+
Potential Target: $1,000
If the breakout is confirmed with strong volume and momentum, BNB could rally sharply in the coming weeks. Traders should watch for confirmation before entering.

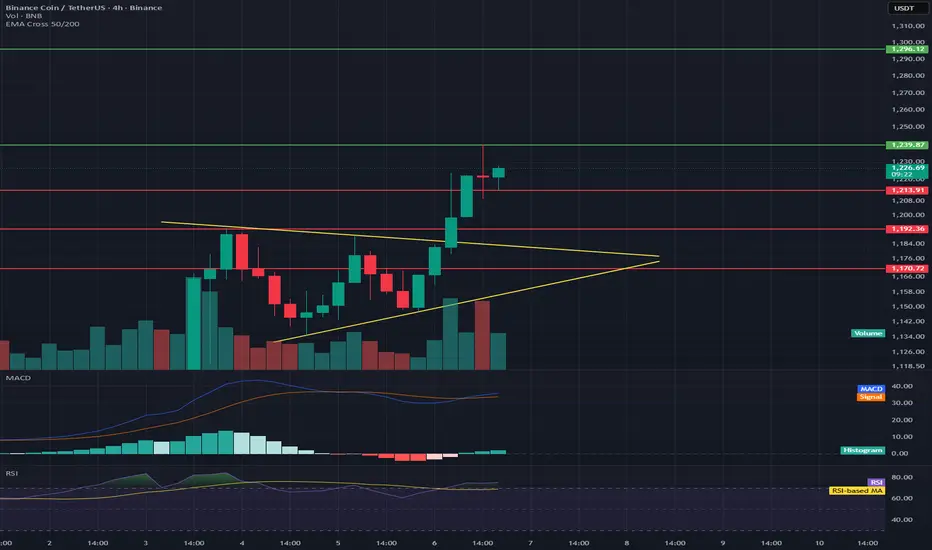
BNB/USDT 4H Chart Review📊 Market Structure
The chart shows a symmetrical triangle (yellow lines) from which a breakout occurred upwards—a classic signal of a continuing uptrend.
The price has broken above resistance at ~$1,210, which now acts as local support.
Current price: ~$1,226, following a dynamic breakout from the triangle.
📈 Key Levels
Support:
$1,210 — Retest after the breakout (important defensive level for bulls)
$1,193 — Previous local support in the triangle
$1,170 — Stronger support and lower boundary of the previous consolidation
Resistance:
$1,239 — Local resistance that has already been tested
$1,260–$1,265 — Next target upon breakout (equal movement or measuring the height of the triangle)
$1,300 — Psychological and technical resistance level
📊 Volume
The breakout was confirmed by a significant increase in volume, lending it credibility.
No sharp drop in volume after the breakout — the market remains in demand.
⚙️ MACD
The MACD is above the signal line and rising, confirming a bullish impulse.
The histogram is positive, but not excessively broad → momentum is healthy, but not overheated.
💪 RSI
RSI: ~75, which is slightly in the overbought zone.
It's worth watching for a short-term correction or retest of the $1,210 level before the uptrend becomes more established.
BNB To Cool Off?Since we talked about BNB in the intro, I thought I would take a quick look at the chart… I think this is clearly a bullish asset, so I would be looking for a nice dip to buy if the opportunity arises. If not, cest la vie.
We have overbought bearish divergence on the daily, and on multiple time frames below. If this week closes lower, we could also see it on the weekly.
This could easily drop 20% and still look quiet bullish. Anything below $1,000 would be a gift, assuming we believe the bull market is continuing.

BNB ATH to 2k
At least 1200 imho
Binance continues to be one of the most profitable crypto exchanges globally.
It saw strong year-over-year revenue growth in 2024, though slightly below its high mark in 2021.
Significant profit in just the final quarter suggests savvy cost management and peak market conditions.

BNB is definitely on its way to $1000.BNB has been consolidating for around 250 days , which is a solid amount of time to build momentum for a breakout. It's almost certain that BNB will hit $1000 soon .
However, this prediction becomes invalid if the price breaks down below $500 with significant volume.
A good price range for accumulation is between $500–$650.
CRYPTO:BNBUSD

BNB/USDT 4h chart review1. Trend and structure
• The price struck the relegation (orange) line, which is a positive signal.
• Currently, the course oscillates around 1007 USDT after reflection from holes ~ 930.
2. Key levels
• Support: 995, 971, 930.
• Resistance: 1026, 1051, 1084.
3. MacD
• The histogram grows, but begins to slightly weaken.
• MacD line still above the signal → slightly bullish signal, but with braking signs.
4. RSI (4H)
• RSI around 55–60 → neutral/bullish, not yet burdened.
5. Simple interpretation
• As long as the course lasts above 995, the upward scenario is possible.
• Breaking above 1026 will open the road to 1051 and 1084.
• decrease below 995 → Risk of retests 971, and later 930.

$BNBThe BNB/USDT pair is currently undergoing a retracement after failing to break through the supply zone around 1050–1060. Price structure indicates a possible pullback toward the demand area near 1000–1005, which serves as a key support level and a buyer accumulation zone.
As long as this demand zone holds, there is a strong chance of a rebound with the next target around 1050. However, if the demand is broken, the short-term bullish structure will weaken, opening room for a deeper correction.
In conclusion, the primary scenario still favors a bullish continuation as long as price holds above 1000. The demand zone is the key validation area before the market can resume its path toward supply.

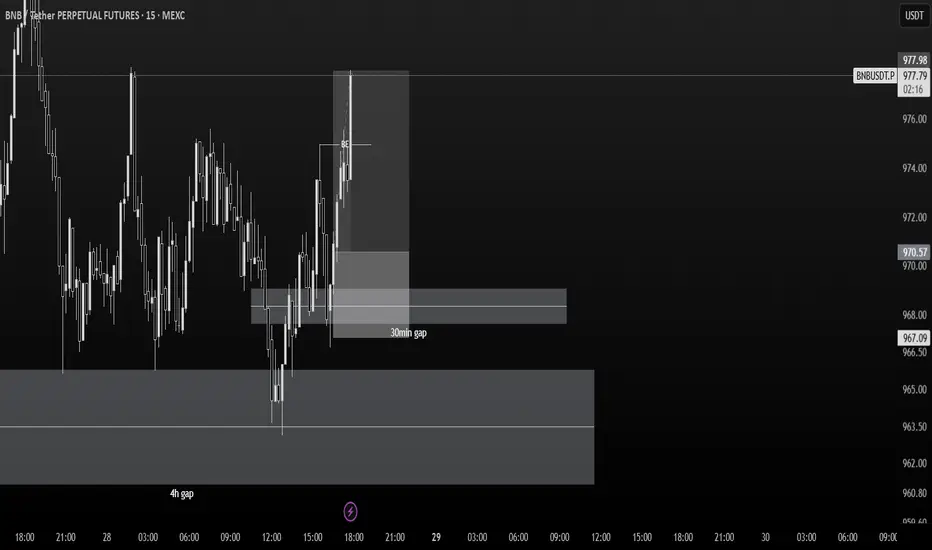
ifvg setupHello guys, we are back with this setup.
im kind of backtesting my overall system and im getting quite good results.
in today's setup in bnb we saw that price actually delivering from a 4h fvg, although the trend in barish and it's a bit risky but we waited for a confirmation and waited for the 30min gap to be disrespected and managed to break through with displacement, and we enterd in the 5 min time frame, and that's it, very simple.
I'm shorting $BNB here, guys...📉 ... We just had our first touch at the 1.618 Fibonacci extension — around $1,006 — and I seriously doubt it’s going to break through cleanly and fly into price discovery. 🚫📈
📊 Weekly chart looks extremely extended, and this Fib level is a classic reversal zone.
No clear volume support above, and the rally looks overextended.
⚠️ Risk is asymmetric here — I’m betting on the first rejection.
If I’m wrong, I’ll cut quick.
But if I’m right, we might catch a nasty drop from the top. 💥
🔎 Let’s see how this plays out.

BNBUSDT – Distribution Before BreakdownAfter a strong bullish run, BNB formed equal highs and showed bearish divergence on RSI, hinting at exhaustion. Price swept the liquidity above, then reversed sharply with strong volume. Current structure suggests supply taking control, targeting the demand zone around previous equal lows.
Risk management is key – watching how price reacts at major support will decide continuation or deeper correction.

#BNBUSDT - Aug 2025Date: 17-08-2025
#BNBUSDT - Current Price: $853.38
#BNBUSDT Pivot Point: $840.99 Support: $808.51 Resistance: $873.75
#BNBUSDT Upside Targets:
--------------------------------
| Target | Price |
---------------------------------
| 🎯 Target 1 | $914.20 |
| 🎯 Target 2 | $954.65 |
| 🎯 Target 3 | $997.27 |
| 🎯 Target 4 | $1,039.89 |
#BNBUSDT Downside Targets:
| 🎯 Target 1 | $767.92 |
| 🎯 Target 2 | $727.33 |
| 🎯 Target 3 | $684.70 |
| 🎯 Target 4 | $642.08 |
#Crypto #Bitcoin #BTC #CryptoTA #TradingView #PivotPoints #SupportResistance
#SOLANA #ETHEREUM #BTCUSD #MATICUSDT #XRPUSDT

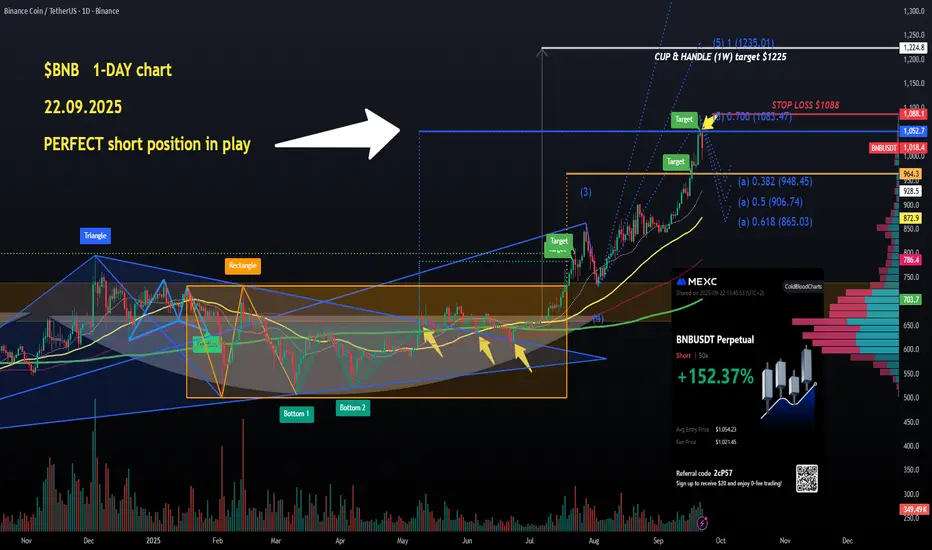
$BNB my short from $1056 has been PRINTINGOk so my only new position opened over the weekend, CRYPTOCAP:BNB short from $1056 has been doing well for sure.
Yesterday I gave a target zone between $977 and $997, and it was a decent enough 'guess' I suppose as #bnb hit $995 before being bought up and back into 4 digit zone again.
I'm holding and moving my STOP LOSS to $1088 to reduce risk and I'm setting my Take Profit to $975 and $931 due to the accumulation of late long liquidations at these levels.
You do you, it's but a trading journal for me💙👽