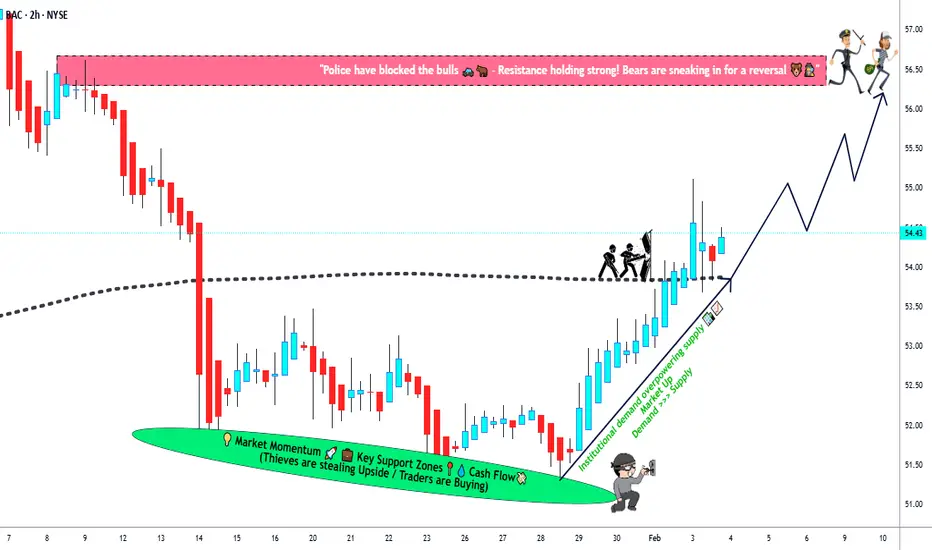
Bank of America (BAC) — Breakout Structure Analysis🏦 BAC Bank Heist Alert: Moving Average Breakout & Retest Play! 💰
📊 BANK OF AMERICA CORPORATION (NYSE: BAC)
Market Strategy: Bullish Day/Swing Trade Setup 🎯
Trading Style: Thief's Layered Entry Method
🎯 THE SETUP
📍 Entry Strategy: Flexible Multi-Layer Approach
The "Thief Strategy" utilizes multiple
Bank of America Corp
No trades
Key facts today
Next report date
—
Report period
—
EPS estimate
—
Revenue estimate
—
3.305 EUR
25.98 B EUR
163.10 B EUR
About Bank of America Corporation
Sector
Industry
CEO
Brian T. Moynihan
Website
Headquarters
Charlotte
Founded
1904
IPO date
Jun 5, 1979
Identifiers
3
ISIN US0605051046
Bank of America Corp. is a bank and financial holding company, which engages in the provision of banking and nonbank financial services. It operates through the following segments: Consumer Banking, Global Wealth and Investment Management (GWIM), Global Banking, Global Markets, and All Other. The Consumer Banking segment offers credit, banking, and investment products and services to consumers and small businesses. The GWIM segment focuses on solutions to meet clients’ needs through a full set of investment management, brokerage, banking, and retirement products. The Global Banking segment deals with lending-related products and services, integrated working capital management and treasury solutions to clients, and underwriting and advisory services. The Global Markets segment includes sales and trading services, as well as research, to institutional clients across fixed-income, credit, currency, commodity, and equity businesses. The All Other segment consists of asset and liability management activities, equity investments, non-core mortgage loans and servicing activities, the net impact of periodic revisions to the mortgage servicing rights valuation model for both core and non-core MSRs, other liquidating businesses, residual expense allocations and other. The company was founded by Amadeo Peter Giannini in 1904 and is headquartered in Charlotte, NC.
Related stocks
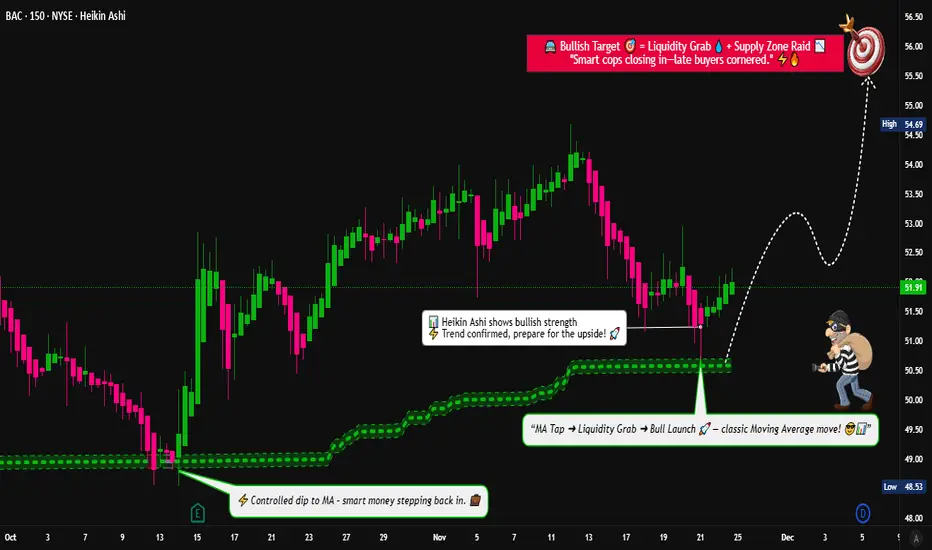
BAC: Buying Time, Not Noise — Long LEAP After Structural ReclaimBank of America has reclaimed key moving averages after a controlled pullback, and price is now holding above former resistance near the mid-$50s. Rather than chasing short-term momentum or trying to time every candle, this idea focuses on structure + time.
I initiated a long-dated LEAP (Sep 2026 $

Bank of America Wave Analysis – 4 February 2026- Bank of America rising inside impulse wave 5
- Likely to test resistance level 57.00
Bank of America recently broke the resistance zone between the resistance level 53.4 (which stopped wave (b) in January) and the 38.2% Fibonacci correction of the previous ABC correction 2 from the start of Janua

Bank of America $53.20 Breakout Setup Targets $54.50 This Week:Current Price: 53.20 (Analysis was generated on Monday Morning)
Direction: LONG
Confidence level: 64%(Professional traders broadly favor upside continuation above $52.60, X sentiment from high-impact accounts is strongly bullish after earnings, and technical momentum supports a short-term push hig

Bank of America Wave Analysis – 29 January 2026- Bank of America reversed from support area
- Likely to rise to resistance level 53.45
Bank of America recently reversed from the support area between the pivotal support level 51.20 (which has been reversing the price from November), lower daily Bollinger Band and the 61.8% Fibonacci correction o

Bank of America – Between Pressure and OpportunityIn the context of the declines recorded by the stock following the publication of financial results, the price has moved significantly closer to the support line of the ascending trend, trading below the 50-day moving average, while the RSI indicator signals a clear approach toward oversold territor

Earnings Breakout Setup — QS Flags Bullish Edge Before earningBAC Earnings Signal | 2026-01-13
📊 TRADE DETAILS 📊
🎯 Instrument: BAC
🔀 Direction: CALL (LONG)
🎯 Strike: 54.50
💵 Entry Price: 0.98
🎯 Profit Target: 1.47
🛑 Stop Loss: 0.64
📅 Expiry: 2026-01-16
📏 Size: 5.0
📈 Confidence: 78%
⏰ Entry Timing: N/A
🕒 Signal Time: 2026-01-13 13:36:34 EST
Why Trade:
BAC ha

BAC Bank of America 1Y Chart Review - RSI/KC concernToday you can review the technical analysis idea on a 1Y linear scale chart for Bank of America (BAC).
It seems there is some action going on here with BAC reviewing the RSI and the Keltner Channel. This may be a concern.
If you enjoy my ideas, feel free to like it and drop in a comment. I love re

BAC, Massive Descending-Triangle, Huge BREAKOUT-Expansion Setup!Hello There!
Welcome to my new analysis of BAC. In recent times I have spotted important value stocks within the market that have the potential to emerge with a major transformational reversal and indicate main expansional determinations once the appropriate confirmations have emerged. In this cas

BAC Pullback Into MA — Is This the Next Swing Continuation Move?🔥📈 BAC — Bullish Pullback Playbook Into MA | Thief-Style Layer Entry 📊💼
Hey Traders! 😎
Here’s my Bullish Pullback Into Moving Average playbook on BAC — Bank of America Corp (NYSE).
Clean setup, thief-friendly layering, and a classy escape plan 😅🕶️💸
📘 Asset
BAC — Bank of America Corporation (NYSE)
See all ideas
Summarizing what the indicators are suggesting.
Neutral
SellBuy
Strong sellStrong buy
Strong sellSellNeutralBuyStrong buy
Neutral
SellBuy
Strong sellStrong buy
Strong sellSellNeutralBuyStrong buy
Neutral
SellBuy
Strong sellStrong buy
Strong sellSellNeutralBuyStrong buy
An aggregate view of professional's ratings.
Neutral
SellBuy
Strong sellStrong buy
Strong sellSellNeutralBuyStrong buy
Neutral
SellBuy
Strong sellStrong buy
Strong sellSellNeutralBuyStrong buy
Neutral
SellBuy
Strong sellStrong buy
Strong sellSellNeutralBuyStrong buy
Displays a symbol's price movements over previous years to identify recurring trends.
XS2881617471
Bank of America Corporation 6.2% 16-AUG-2044Yield to maturity
39.01%
Maturity date
Aug 16, 2044
XS32069088
Merrill Lynch & Co., Inc. 8.49% 13-SEP-2027Yield to maturity
9.31%
Maturity date
Sep 13, 2027
XS1973749267
Bank of America Corporation 7.45% 18-APR-2029Yield to maturity
7.45%
Maturity date
Apr 18, 2029
BAC5127412
Bank of America Corporation 0.8% 24-FEB-2026Yield to maturity
7.28%
Maturity date
Feb 24, 2026
XS2631573461
Bank of America Corporation 6.9% 05-JUN-2028Yield to maturity
6.89%
Maturity date
Jun 5, 2028
XS2814861360
Bank of America Corporation 6.5% 07-MAY-2039Yield to maturity
6.50%
Maturity date
May 7, 2039
XS2815876508
Bank of America Corporation 6.5% 07-MAY-2039Yield to maturity
6.50%
Maturity date
May 7, 2039
See all BOAC bonds
Frequently Asked Questions
The current price of BOAC is 44.205 EUR — it has increased by 0.55% in the past 24 hours. Watch Bank of America Corp stock price performance more closely on the chart.
Depending on the exchange, the stock ticker may vary. For instance, on VIE exchange Bank of America Corp stocks are traded under the ticker BOAC.
BOAC stock has fallen by −5.07% compared to the previous week, the month change is a −5.81% fall, over the last year Bank of America Corp has showed a −0.39% decrease.
We've gathered analysts' opinions on Bank of America Corp future price: according to them, BOAC price has a max estimate of 60.10 EUR and a min estimate of 46.56 EUR. Watch BOAC chart and read a more detailed Bank of America Corp stock forecast: see what analysts think of Bank of America Corp and suggest that you do with its stocks.
BOAC reached its all-time high on Jan 7, 2026 with the price of 48.860 EUR, and its all-time low was 17.075 EUR and was reached on Mar 23, 2020. View more price dynamics on BOAC chart.
See other stocks reaching their highest and lowest prices.
See other stocks reaching their highest and lowest prices.
BOAC stock is 1.22% volatile and has beta coefficient of 1.40. Track Bank of America Corp stock price on the chart and check out the list of the most volatile stocks — is Bank of America Corp there?
Today Bank of America Corp has the market capitalization of 319.31 B, it has increased by 2.75% over the last week.
Yes, you can track Bank of America Corp financials in yearly and quarterly reports right on TradingView.
Bank of America Corp is going to release the next earnings report on Apr 15, 2026. Keep track of upcoming events with our Earnings Calendar.
BOAC earnings for the last quarter are 0.83 EUR per share, whereas the estimation was 0.82 EUR resulting in a 2.25% surprise. The estimated earnings for the next quarter are 0.84 EUR per share. See more details about Bank of America Corp earnings.
Bank of America Corp revenue for the last quarter amounts to 24.15 B EUR, despite the estimated figure of 23.64 B EUR. In the next quarter, revenue is expected to reach 25.04 B EUR.
BOAC net income for the last quarter is 6.51 B EUR, while the quarter before that showed 7.22 B EUR of net income which accounts for −9.79% change. Track more Bank of America Corp financial stats to get the full picture.
Yes, BOAC dividends are paid quarterly. The last dividend per share was 0.24 EUR. As of today, Dividend Yield (TTM)% is 2.06%. Tracking Bank of America Corp dividends might help you take more informed decisions.
Bank of America Corp dividend yield was 1.96% in 2025, and payout ratio reached 28.35%. The year before the numbers were 2.28% and 31.12% correspondingly. See high-dividend stocks and find more opportunities for your portfolio.
Like other stocks, BOAC shares are traded on stock exchanges, e.g. Nasdaq, Nyse, Euronext, and the easiest way to buy them is through an online stock broker. To do this, you need to open an account and follow a broker's procedures, then start trading. You can trade Bank of America Corp stock right from TradingView charts — choose your broker and connect to your account.
Investing in stocks requires a comprehensive research: you should carefully study all the available data, e.g. company's financials, related news, and its technical analysis. So Bank of America Corp technincal analysis shows the sell today, and its 1 week rating is sell. Since market conditions are prone to changes, it's worth looking a bit further into the future — according to the 1 month rating Bank of America Corp stock shows the buy signal. See more of Bank of America Corp technicals for a more comprehensive analysis.
If you're still not sure, try looking for inspiration in our curated watchlists.
If you're still not sure, try looking for inspiration in our curated watchlists.