Barclays Raises TechnipFMC (FTI) Price Target to $43TechnipFMC (NYSE: NYSE:FTI ) closed at $31.23 on the previous trading day, staying close to its one-year high of $33.45. Evercore ISI analyst Jason Bandel maintained a Buy rating on the stock, setting a price target of $39. Meanwhile, Barclays reaffirmed its Buy rating with a higher target of $43 i
Next report date
—
Report period
—
EPS estimate
—
Revenue estimate
—
2.16 USD
842.90 M USD
9.08 B USD
407.14 M
About TechnipFMC plc
Sector
Industry
CEO
Douglas J. Pferdehirt
Website
Headquarters
Houston
Founded
2015
ISIN
GB00BDSFG982
FIGI
BBG00DL8NMV2
TechnipFMC plc is an energy service company, which engages in the provision of solutions for the production and transformation of hydrocarbons. It operates through the following segments: Subsea and Surface Technologies. The Subsea segment designs and manufactures products and systems, performs engineering, procurement and project management, and provides services used by oil and gas companies involved in offshore exploration and production of crude oil and natural gas. The Surface Technologies segment designs and manufactures products and systems, and provides services used by oil and gas companies involved in land and offshore exploration and production of crude oil and natural gas. The company was founded in 1884 and is headquartered in Houston, TX.
Related stocks

Buying TechnipFMC Bonds- Issuer: TechnipFMC
- ISIN: FR0011273432
- Coupon: 4.00% in euros (payment 1 time per year)
- Repayment: June 15, 2027
- Yield to maturity: 5.46%
- Rating: BBB-
- Award: +2% for assets of similar quality
Justification of the purchase:
TechnipFMC is a leading international company operating in the

FTI & oil next week: UPMy dowsing picked this stock in November or so and on 11/16 gave today as a future date to watch for a move up.
Twice I get the "safe and profitable to buy" option today and parabolic daily chart option. Twice I get a target of $26, which seems kinda nuts ;) but that's fine.
It might be a better en

Clear winner in this sell off marketGood run on higher than average volume. Adding to watchlist. Can be a leader when market turns NYSE:FTI

Oil stocks moving BUY!!Oil stocks are moving. Buy the strong ones. This is a good chance to move your account by 7 - 15% in a month!! with a risk of about 3%
NYSE:OII NYSE:TDW NYSE:FTI NYSE:TTI NYSE:HLX
Reasoning
Whole Industry is moving!
Consolidation seems done
Correction is not overextended
Goo

Buder Trend Trade on FTITrend trade on FTI(not FTX, lol).
Why I like this idea:
1. Strong, healthy bullish market structure(higher highs, lower lows for months)
2. Well defined channel
3. 50 EMA is acting as support
5. Local fixed range volume area as support
6. Local fixed range volume POC as support
7. A confluence of

$FTI ~ Expect run to continue...Expect run to continue as shown. With this administration remaining hawkish towards oil, off shore requirements will continue to increase.

FTI long the oil service and equipment industry has been on fire and there are still some stocks in the sector that have not run as hard as their peers. I think FTI is one of them. Pretty large order flow the past week aswell. I would like this to get over 7.05 and base will prob see a little rejection arou
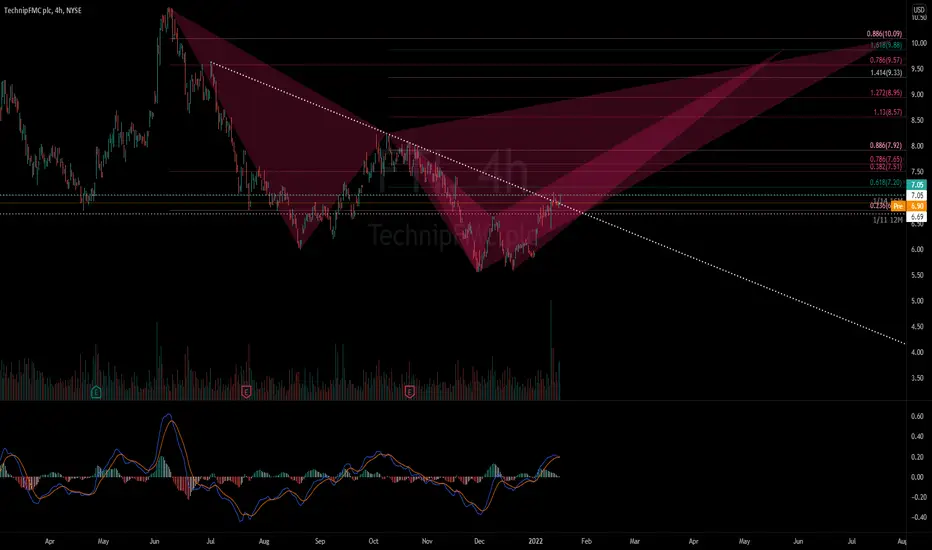
fti buybuy after the break and above the resistance level at 6.90 .. first target next resistance level 7.95 .. finally target 9.00

TechnipFMC Awarded Large Subsea Contract for Additional StabroekFTI: TechnipFMC plc
2021-11-15 16:15:00
TechnipFMC Awarded Large Subsea Contract for Additional Stabroek Block Project

See all ideas
An aggregate view of professional's ratings.
Neutral
SellBuy
Strong sellStrong buy
Strong sellSellNeutralBuyStrong buy
Neutral
SellBuy
Strong sellStrong buy
Strong sellSellNeutralBuyStrong buy
Neutral
SellBuy
Strong sellStrong buy
Strong sellSellNeutralBuyStrong buy
Displays a symbol's price movements over previous years to identify recurring trends.
TECAD
TechnipFMC plc 4.0% 14-JUN-2032Yield to maturity
4.93%
Maturity date
Jun 14, 2032
TECAE
TechnipFMC plc 3.75% 07-OCT-2033Yield to maturity
4.36%
Maturity date
Oct 7, 2033
TECAA
TechnipFMC plc 4.0% 15-JUN-2027Yield to maturity
3.99%
Maturity date
Jun 15, 2027
See all FTI bonds
Frequently Asked Questions
Depending on the exchange, the stock ticker may vary. For instance, on BOATS exchange TechnipFMC plc stocks are traded under the ticker FTI.
We've gathered analysts' opinions on TechnipFMC plc future price: according to them, FTI price has a max estimate of 51.00 USD and a min estimate of 30.00 USD. Watch FTI chart and read a more detailed TechnipFMC plc stock forecast: see what analysts think of TechnipFMC plc and suggest that you do with its stocks.
Yes, you can track TechnipFMC plc financials in yearly and quarterly reports right on TradingView.
TechnipFMC plc is going to release the next earnings report on Oct 23, 2025. Keep track of upcoming events with our Earnings Calendar.
FTI earnings for the last quarter are 0.68 USD per share, whereas the estimation was 0.58 USD resulting in a 18.02% surprise. The estimated earnings for the next quarter are 0.66 USD per share. See more details about TechnipFMC plc earnings.
TechnipFMC plc revenue for the last quarter amounts to 2.53 B USD, despite the estimated figure of 2.48 B USD. In the next quarter, revenue is expected to reach 2.61 B USD.
FTI net income for the last quarter is 269.50 M USD, while the quarter before that showed 142.00 M USD of net income which accounts for 89.79% change. Track more TechnipFMC plc financial stats to get the full picture.
Yes, FTI dividends are paid quarterly. The last dividend per share was 0.05 USD. As of today, Dividend Yield (TTM)% is 0.52%. Tracking TechnipFMC plc dividends might help you take more informed decisions.
As of Oct 4, 2025, the company has 25.3 K employees. See our rating of the largest employees — is TechnipFMC plc on this list?
EBITDA measures a company's operating performance, its growth signifies an improvement in the efficiency of a company. TechnipFMC plc EBITDA is 1.57 B USD, and current EBITDA margin is 14.79%. See more stats in TechnipFMC plc financial statements.
Like other stocks, FTI shares are traded on stock exchanges, e.g. Nasdaq, Nyse, Euronext, and the easiest way to buy them is through an online stock broker. To do this, you need to open an account and follow a broker's procedures, then start trading. You can trade TechnipFMC plc stock right from TradingView charts — choose your broker and connect to your account.