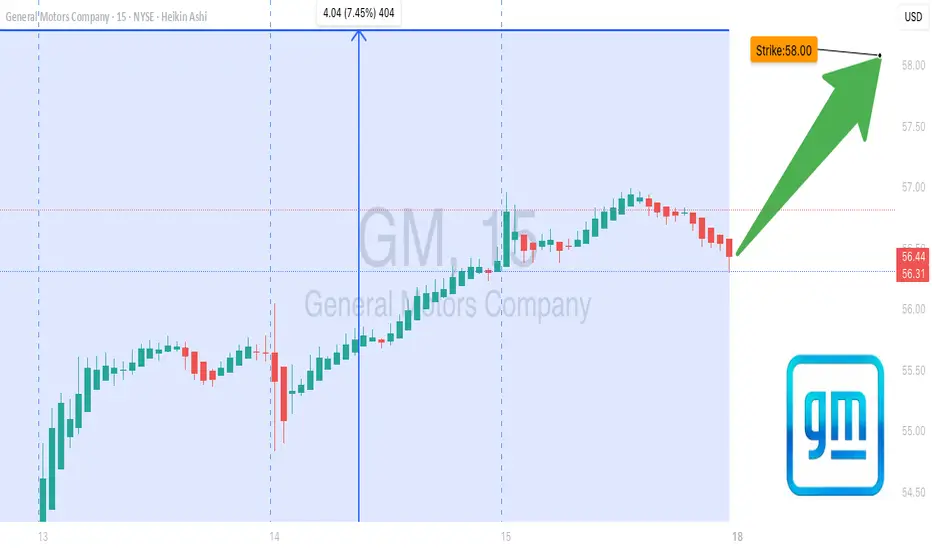
GM Breakout Watch – Calls Ready to Pop🚀 GM Swing Trade – \$58 Calls in Play!**
**Moderate Bullish Bias | Aug 15, 2025**
**📊 Key Highlights:**
* **RSI:** 74.2 – Strong bullish momentum 🔥
* **Price Momentum:** 5D +6.0%, 10D +8.0% 📈
* **Volume:** Weak ⚠️ (1.0x avg vs 1.3x needed)
* **Options Flow:** Neutral – No strong institutional lea
Next report date
—
Report period
—
EPS estimate
—
Revenue estimate
—
6.42 USD
6.01 B USD
187.44 B USD
950.21 M
About General Motors Company
Sector
Industry
CEO
Mary Teresa Barra
Website
Headquarters
Detroit
Founded
1908
ISIN
US37045V1008
FIGI
BBG000NDYB67
General Motors Co. engages in the designing, manufacturing, and selling of trucks, crossovers, cars, and automobile parts, and in providing software-enabled services and subscriptions. It operates through the following segments: GMNA, GMI, Cruise, and GM Financial. The company was founded by William C. Durant on September 16, 1908 and is headquartered in Detroit, MI.
Related stocks
General Motors: Strong EV Strategy and Earnings Momentum Signal Current Price: $53.22
Direction: LONG
Targets:
- T1 = $54.45
- T2 = $55.54
Stop Levels:
- S1 = $52.34
- S2 = $51.10
**Wisdom of Professional Traders:**
This analysis synthesizes insights from thousands of professional traders and market experts, leveraging collective intelligence to identify

Like this set up on GM using the 3 touch point TL StrategyLike this set up on GM using the 3 touch point trendline strategy

General Motors (NYSE: $GM) Reports 17% Y0Y in Q12025 Sales General Motors (NYSE: NYSE:GM ) opened at $44.46 on April 4th, 2025, down 3.91%. The stock declined $1.80 in early trading. This came a day after Trump’s new 25% auto import tariffs took effect. In a report released on April 2nd, GM delivered 693,363 vehicles in Q1 2025, a 17% year-over-year increa

GM Stock Chart Fibonacci Analysis 032125Trading Idea
1) Find a FIBO slingshot
2) Check FIBO 61.80% level
3) Entry Point > 48/61.80%
Chart time frame: C
A) 15 min(1W-3M)
B) 1 hr(3M-6M)
C) 4 hr(6M-1year)
D) 1 day(1-3years)
Stock progress: A
A) Keep rising over 61.80% resistance
B) 61.80% resistance
C) 61.80% support
D) Hit the bottom
E

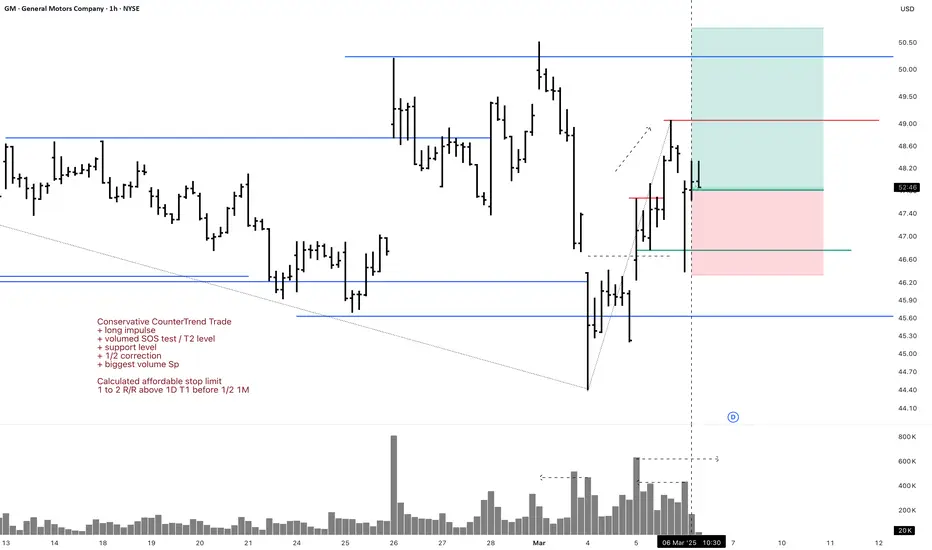
GM 1H Long Swing Conservative CounterTrend TradeConservative CounterTrend Trade
+ long impulse
+ volumed SOS test / T2 level
+ support level
+ 1/2 correction
+ biggest volume Sp
Calculated affordable stop limit
1 to 2 R/R above 1D T1 before 1/2 1M
Daily CounterTrend
"- short balance
- unvolumed expanding T1
+ volumed 2Sp+
+ test"
Monthly Trend
GM 5M Long Conservative Trend TradeConservative Trend Trade
+ long impulse
+ SOS level
+ support level
+ 1/2 correction
+ Sp
Calculated affordable stop limir
1 to 2 R/R take profit
1H Trend
"+ long impulse
+ volumed SOS test / T2 level
+ support level
+ 1/2 correction
+ biggest volume Sp
+ weak test
+ first buying bar closed"
1D C

GM Surging on Buyback & Dividend News! Can Bulls Push to $50+?Technical Analysis for February 27, 2025:
1. Current Price Action:
* GM surged on buyback and dividend news, reaching a high of $50.19 before pulling back to $48.60.
* Forming an ascending wedge pattern, indicating either a continuation or a breakdown.
* POC (Point of Control) at $48 is

General Motors: Is All the Bad News Priced In?Tariff fears have battered General Motors, but some traders may see an opportunity.
The first pattern on today’s chart is the price gap from January 28 after the automaker reported quarterly results. At the time, tariff fears overshadowed better-than-expected earnings and revenue. But now Trump has

$GM Continued Uptrend LONGRisk is the political landscape, but upside is 30% with sector P/E OF 8-11 excluding $TSLA.
You're getting fair value here with upside of forward EPS of >$10.
$10*8=80
Don't overthink it, ride the trend up. President could mess it up but until then we're wave riding.

See all ideas
An aggregate view of professional's ratings.
Neutral
SellBuy
Strong sellStrong buy
Strong sellSellNeutralBuyStrong buy
Neutral
SellBuy
Strong sellStrong buy
Strong sellSellNeutralBuyStrong buy
Neutral
SellBuy
Strong sellStrong buy
Strong sellSellNeutralBuyStrong buy
Displays a symbol's price movements over previous years to identify recurring trends.
G
GM5208782
General Motors Financial Company, Inc. 1.85% 20-JUL-2027Yield to maturity
—
Maturity date
Jul 20, 2027
G
GM5416540
General Motors Financial Company, Inc. 4.25% 20-MAY-2026Yield to maturity
—
Maturity date
May 20, 2026
G
GM5160778
General Motors Financial Company, Inc. 1.7% 20-APR-2026Yield to maturity
—
Maturity date
Apr 20, 2026
G
GM5295752
General Motors Financial Company, Inc. 2.4% 20-NOV-2028Yield to maturity
—
Maturity date
Nov 20, 2028
G
GM4617456
General Motors Financial Company, Inc. 4.5% 20-APR-2028Yield to maturity
—
Maturity date
Apr 20, 2028
G
GM5832262
General Motors Financial Company, Inc. 5.35% 15-JUL-2027Yield to maturity
—
Maturity date
Jul 15, 2027
G
GM5885579
General Motors Financial Company, Inc. 4.9% 06-OCT-2029Yield to maturity
—
Maturity date
Oct 6, 2029
G
GM4542116
General Motors Financial Company, Inc. 3.95% 20-SEP-2027Yield to maturity
—
Maturity date
Sep 20, 2027
G
GM5832263
General Motors Financial Company, Inc. FRN 15-JUL-2027Yield to maturity
—
Maturity date
Jul 15, 2027
See all GM bonds
Curated watchlists where GM is featured.


Frequently Asked Questions
Depending on the exchange, the stock ticker may vary. For instance, on BOATS exchange General Motors Company stocks are traded under the ticker GM.
We've gathered analysts' opinions on General Motors Company future price: according to them, GM price has a max estimate of 80.00 USD and a min estimate of 38.00 USD. Watch GM chart and read a more detailed General Motors Company stock forecast: see what analysts think of General Motors Company and suggest that you do with its stocks.
Yes, you can track General Motors Company financials in yearly and quarterly reports right on TradingView.
General Motors Company is going to release the next earnings report on Oct 21, 2025. Keep track of upcoming events with our Earnings Calendar.
GM earnings for the last quarter are 2.53 USD per share, whereas the estimation was 2.34 USD resulting in a 8.25% surprise. The estimated earnings for the next quarter are 2.23 USD per share. See more details about General Motors Company earnings.
General Motors Company revenue for the last quarter amounts to 47.12 B USD, despite the estimated figure of 45.99 B USD. In the next quarter, revenue is expected to reach 44.62 B USD.
GM net income for the last quarter is 1.90 B USD, while the quarter before that showed 2.78 B USD of net income which accounts for −31.93% change. Track more General Motors Company financial stats to get the full picture.
Yes, GM dividends are paid quarterly. The last dividend per share was 0.15 USD. As of today, Dividend Yield (TTM)% is 0.87%. Tracking General Motors Company dividends might help you take more informed decisions.
General Motors Company dividend yield was 0.90% in 2024, and payout ratio reached 7.54%. The year before the numbers were 1.00% and 4.92% correspondingly. See high-dividend stocks and find more opportunities for your portfolio.
As of Sep 17, 2025, the company has 162 K employees. See our rating of the largest employees — is General Motors Company on this list?
EBITDA measures a company's operating performance, its growth signifies an improvement in the efficiency of a company. General Motors Company EBITDA is 29.07 B USD, and current EBITDA margin is 12.93%. See more stats in General Motors Company financial statements.
Like other stocks, GM shares are traded on stock exchanges, e.g. Nasdaq, Nyse, Euronext, and the easiest way to buy them is through an online stock broker. To do this, you need to open an account and follow a broker's procedures, then start trading. You can trade General Motors Company stock right from TradingView charts — choose your broker and connect to your account.