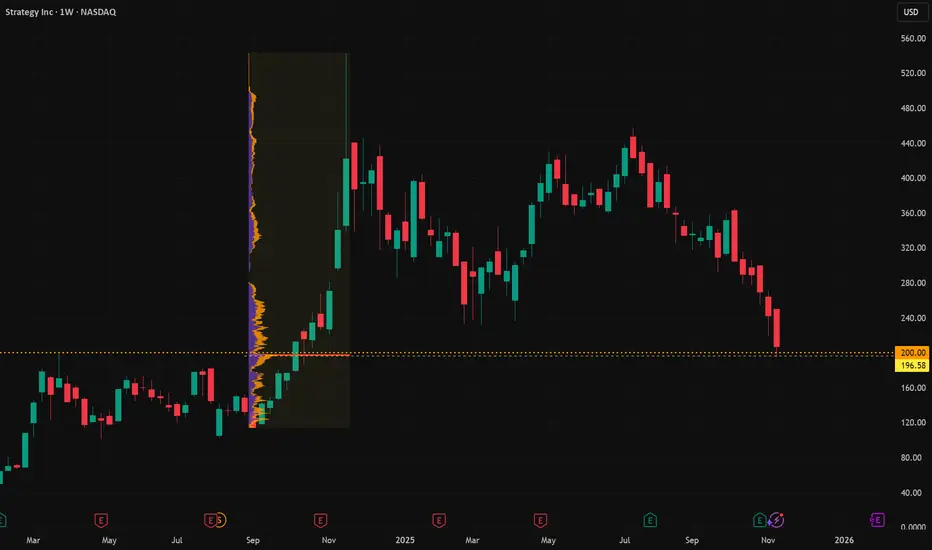
MicroStrategy - The red channel of doom returns - November 2025Ah, MicroStrategy…. the stock that’s half software company, half Bitcoin cult. Every time you think it’s about to behave like a normal tech firm, Michael Saylor pops up with a grin, another billion dollars of debt, and the conviction of a man who’s never heard the words “margin call.”
And here we ar
Next report date
—
Report period
—
EPS estimate
—
Revenue estimate
—
26.02 USD
−1.17 B USD
463.46 M USD
267.17 M
About Strategy Inc
Sector
Industry
CEO
Phong Q. Le
Website
Headquarters
Vienna
Founded
1989
ISIN
US5949728878
FIGI
BBG01S3K7WZ3
Strategy, Inc. engages in the provision of enterprise analytics and mobility software. The firm designs, develops, markets, and sells software platforms through licensing arrangements and cloud-based subscriptions and related services. Its product packages include Hyper. The company was founded by Michael J. Saylor and Sanjeev K. Bansal on November 17, 1989, and is headquartered in Vienna, VA.
Related stocks

MSTR - Ripping Short Squeeze Could Be In The PipelineHas looked terrible for quite some time now.
And although it may not ever make another high, I think it may be time for a hard bounce.
Notice that as Bitcoin hits $94K, it has gone oversold on the week RSI and has re-tested the previous tier - 2024 peak.
For this to be a perfect setup, MSTR would

Exited 75% of my short trade - relief rally incoming?Before you ask me if I am crazy for closing my short and expecting a bounce, you should know I caught the exact top in MSTR at $560; when people were falling over themselves to buy this ponzi (see linked trade idea). The bulls laughed at that trade when I took it, but it's been one of the best short

Final Leg of Epic Run - Blow off top reaching climaxMicrostrategy has exceeded all expectations, smashing past previous all time highs along with Bitcoin. As Bitcoin approaches 100k, now is a good time for bears to consider where they can short Microstrategy in the event of a pullback.
I think this is setting up an opportunity for an epic short oppo

MSTR to $676MSTR is on major support, looking to run to $676 once bitcoin lifts (currently just below it's long term trend buy area).
Good luck!

MSTR chart update. Bounce to $266-315 before more downside?Updating the prior chart as the levels I had were off. I think it's likely that we bounce from this level.
You can see we've now hit a key support and filled a gap that was on the chart at $176. I think it's likely that we see a strong bounce from this level.
Reasons being:
1. We're at a key su

MSTR Short Closed: Michael Burry vibesI started my NASDAQ:MSTR short last November during the retail yeet. I really took a dislike to Saylor telling people to mortgage all they could to buy Bitcoin and then later to buy stock in his company. The history of finance is littered with con men saying and doing such things. History doesn
Full Reset before Full SendWhy March 2025 Could See New Highs
What's Happening Right Now?
Everyone is freaking out right now, but this is actually creating one of the best buying opportunities we've seen. Bitcoin is trading around $95,600 after dropping about 24% from its peak of $126,000 in October.
The Fear & Greed Ind

MSTR GOES 'BATSHIT STRATEGY', SHED 65% in 12 MONTHS. HERE'S WHY.Strategy stock ( traded as NASDAQ:MSTR ) has experienced dramatic volatility and a downward trend over the past 6 months, shaped by both technical factors and its close link to the cryptocurrency sector, particularly Bitcoin.
Technical Analysis
Strategy Inc stock saw significant declines over

MSTR – Approaching Major Support as Downtrend ContinuesMicroStrategy remains in a clear higher-timeframe downtrend, and if Bitcoin continues to weaken, NASDAQ:MSTR could slide further toward the next major support level — now sitting roughly 63% below its all-time high. This zone may act as a potential reversal area, especially if market sentiment sta

See all ideas
MSTR5946535
Strategy Inc 0.0% 01-DEC-2029Yield to maturity
—
Maturity date
Dec 1, 2029
MSTR6032672
Strategy Inc 0.625% 15-MAR-2030Yield to maturity
—
Maturity date
Mar 15, 2030
US594972AQ4
Strategy Inc 0.625% 15-SEP-2028Yield to maturity
—
Maturity date
Sep 15, 2028
US594972AR2
Strategy Inc 0.0% 01-DEC-2029Yield to maturity
—
Maturity date
Dec 1, 2029
US594972AT8
Strategy Inc 0.0% 01-MAR-2030Yield to maturity
—
Maturity date
Mar 1, 2030
US594972AN1
Strategy Inc 2.25% 15-JUN-2032Yield to maturity
—
Maturity date
Jun 15, 2032
MSTR6034213
Strategy Inc 0.875% 15-MAR-2031Yield to maturity
—
Maturity date
Mar 15, 2031
STRE
Strategy Inc 10.0% PERPYield to maturity
—
Maturity date
—
See all STRK bonds
XPF
iShares S&P/TSX North American Preferred Stock Index ETF (CAD-Hedged) Trust UnitsWeight
0.36%
Market value
587.97 K
USD
Explore more ETFs
Curated watchlists where STRK is featured.


Frequently Asked Questions
Depending on the exchange, the stock ticker may vary. For instance, on BOATS exchange Strategy Inc - 8.00% Series A Perpetual Strike Preferred Stock stocks are traded under the ticker STRK.
STRK reached its all-time high on Jul 1, 2025 with the price of 130.00 USD, and its all-time low was 80.86 USD and was reached on Nov 14, 2025. View more price dynamics on STRK chart.
See other stocks reaching their highest and lowest prices.
See other stocks reaching their highest and lowest prices.
Yes, you can track Strategy Inc - 8.00% Series A Perpetual Strike Preferred Stock financials in yearly and quarterly reports right on TradingView.
Strategy Inc - 8.00% Series A Perpetual Strike Preferred Stock is going to release the next earnings report on Feb 3, 2026. Keep track of upcoming events with our Earnings Calendar.
STRK earnings for the last quarter are 8.42 USD per share, whereas the estimation was −0.10 USD resulting in a 8.35 K% surprise. The estimated earnings for the next quarter are −0.08 USD per share. See more details about Strategy Inc - 8.00% Series A Perpetual Strike Preferred Stock earnings.
Strategy Inc - 8.00% Series A Perpetual Strike Preferred Stock revenue for the last quarter amounts to 128.69 M USD, despite the estimated figure of 116.65 M USD. In the next quarter, revenue is expected to reach 118.75 M USD.
STRK net income for the last quarter is 2.79 B USD, while the quarter before that showed 10.02 B USD of net income which accounts for −72.21% change. Track more Strategy Inc - 8.00% Series A Perpetual Strike Preferred Stock financial stats to get the full picture.
Yes, STRK dividends are paid quarterly. The last dividend per share was 2.00 USD. As of today, Dividend Yield (TTM)% is 0.00%. Tracking Strategy Inc - 8.00% Series A Perpetual Strike Preferred Stock dividends might help you take more informed decisions.
As of Nov 22, 2025, the company has 1.53 K employees. See our rating of the largest employees — is Strategy Inc - 8.00% Series A Perpetual Strike Preferred Stock on this list?
Like other stocks, STRK shares are traded on stock exchanges, e.g. Nasdaq, Nyse, Euronext, and the easiest way to buy them is through an online stock broker. To do this, you need to open an account and follow a broker's procedures, then start trading. You can trade Strategy Inc - 8.00% Series A Perpetual Strike Preferred Stock stock right from TradingView charts — choose your broker and connect to your account.