TLT LongLong entry 89
no stop
Target 94
Risk management is much more important than a good entry point.
I am not a PRO trader.
In my trading plan, the Max Risk of each short term trade should be less than 1% of an account.
Trade ideas

PYPL LongSell put at Support
Long entry 89
no stop
Target 94
Risk management is much more important than a good entry point.
I am not a PRO trader.
In my trading plan, the Max Risk of each short term trade should be less than 1% of an account.

TLT ShortI'm shorting TLT because it's hitting resistance in a long-term downtrend, and technical indicators are overbought. Plus, the Fed just suggested it's pausing rate cuts for now, removing support for bond prices.
I expect TLT to fall, so I’m targeting profits lower, around 70–82.

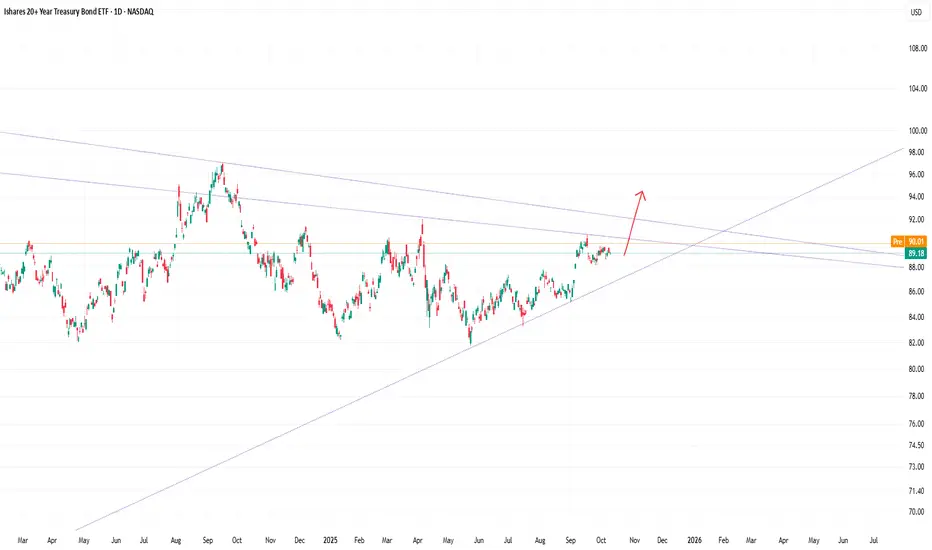
TLT just broke out of a 5 year Descending Channel on the dailyTLT just broke out of a 5 year Descending Channel on the daily. Long Bonds know we are diving into a major recession.

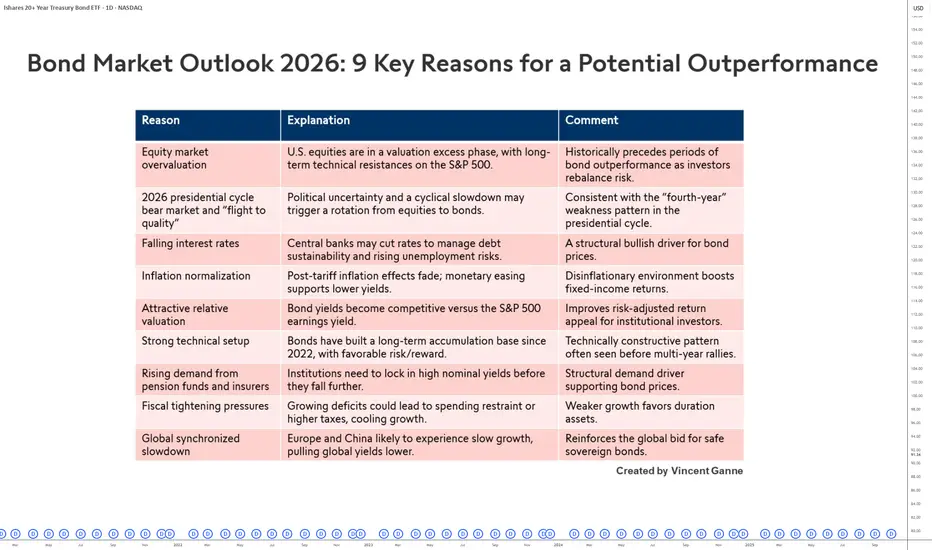
9 Reasons to Gradually Return to BondsAfter several years marked by the dominance of equity markets and interest rate volatility, 2026 could turn out to be more favorable for bonds. Without expecting a spectacular reversal, several economic and structural factors suggest that a relative catch-up of the bond market cannot be ruled out.
First, the high valuation of U.S. equities calls for caution. Indices such as the S&P 500 are at historically stretched technical levels after a long period of growth supported by liquidity and corporate earnings. In this context, a consolidation or profit-taking phase is not unlikely, and such an environment often leads investors to rebalance their exposure toward less risky assets, including bonds.
The U.S. presidential cycle could also play a role. 2026 is the second year of the presidential cycle, which historically tends to be the weakest for the S&P 500, possibly triggering a partial rotation of capital toward bonds, perceived as more stable.
On the macroeconomic front, the prospect of lower interest rates by central banks is another factor to watch. Given high debt levels and a potential weakening of the labor market, the Federal Reserve and the European Central Bank could adopt a looser monetary policy. A decline in rates would mechanically support the value of already issued bonds.
At the same time, the gradual normalization of inflation favors a more predictable environment for bond investors. In the coming months, the impact of tariffs will fade, and more moderate inflation would stabilize real yields and strengthen the appeal of fixed income.
Relative bond yields have also become competitive again compared to equities, as the S&P 500 earnings yield now stands below the 10-year U.S. Treasury yield. For institutional investors, especially pension funds and insurance companies, these levels offer an opportunity for prudent diversification—particularly if equity markets stabilize or correct.
Added to this are fiscal constraints in several developed economies, which could limit stimulus policies and encourage greater market prudence.
In short, without predicting a bond market rally, several factors—relative valuations, monetary policy, inflation, and the economic cycle—suggest that 2026 could mark a period of stronger relative performance for bonds.
Chart showing the monthly candlesticks of the 20-year U.S. bond contract:
DISCLAIMER:
This content is intended for individuals who are familiar with financial markets and instruments and is for information purposes only. The presented idea (including market commentary, market data and observations) is not a work product of any research department of Swissquote or its affiliates. This material is intended to highlight market action and does not constitute investment, legal or tax advice. If you are a retail investor or lack experience in trading complex financial products, it is advisable to seek professional advice from licensed advisor before making any financial decisions.
This content is not intended to manipulate the market or encourage any specific financial behavior.
Swissquote makes no representation or warranty as to the quality, completeness, accuracy, comprehensiveness or non-infringement of such content. The views expressed are those of the consultant and are provided for educational purposes only. Any information provided relating to a product or market should not be construed as recommending an investment strategy or transaction. Past performance is not a guarantee of future results.
Swissquote and its employees and representatives shall in no event be held liable for any damages or losses arising directly or indirectly from decisions made on the basis of this content.
The use of any third-party brands or trademarks is for information only and does not imply endorsement by Swissquote, or that the trademark owner has authorised Swissquote to promote its products or services.
Swissquote is the marketing brand for the activities of Swissquote Bank Ltd (Switzerland) regulated by FINMA, Swissquote Capital Markets Limited regulated by CySEC (Cyprus), Swissquote Bank Europe SA (Luxembourg) regulated by the CSSF, Swissquote Ltd (UK) regulated by the FCA, Swissquote Financial Services (Malta) Ltd regulated by the Malta Financial Services Authority, Swissquote MEA Ltd. (UAE) regulated by the Dubai Financial Services Authority, Swissquote Pte Ltd (Singapore) regulated by the Monetary Authority of Singapore, Swissquote Asia Limited (Hong Kong) licensed by the Hong Kong Securities and Futures Commission (SFC) and Swissquote South Africa (Pty) Ltd supervised by the FSCA.
Products and services of Swissquote are only intended for those permitted to receive them under local law.
All investments carry a degree of risk. The risk of loss in trading or holding financial instruments can be substantial. The value of financial instruments, including but not limited to stocks, bonds, cryptocurrencies, and other assets, can fluctuate both upwards and downwards. There is a significant risk of financial loss when buying, selling, holding, staking, or investing in these instruments. SQBE makes no recommendations regarding any specific investment, transaction, or the use of any particular investment strategy.
CFDs are complex instruments and come with a high risk of losing money rapidly due to leverage. The vast majority of retail client accounts suffer capital losses when trading in CFDs. You should consider whether you understand how CFDs work and whether you can afford to take the high risk of losing your money.
Digital Assets are unregulated in most countries and consumer protection rules may not apply. As highly volatile speculative investments, Digital Assets are not suitable for investors without a high-risk tolerance. Make sure you understand each Digital Asset before you trade.
Cryptocurrencies are not considered legal tender in some jurisdictions and are subject to regulatory uncertainties.
The use of Internet-based systems can involve high risks, including, but not limited to, fraud, cyber-attacks, network and communication failures, as well as identity theft and phishing attacks related to crypto-assets.
Its Time to Diversify YO Bonds - Wu Tang Financial $TLT $IEFyep, the National Debt is about to get reset.. do your reserarch and buy TLT and IEF.

Bonds may begin their generational breakout on Trump's Gas PriceTrump has said that gas is going back below $2.00/gal. We know from recent history that Trump is not to be faded. This deflationary movement may send bonds soaring
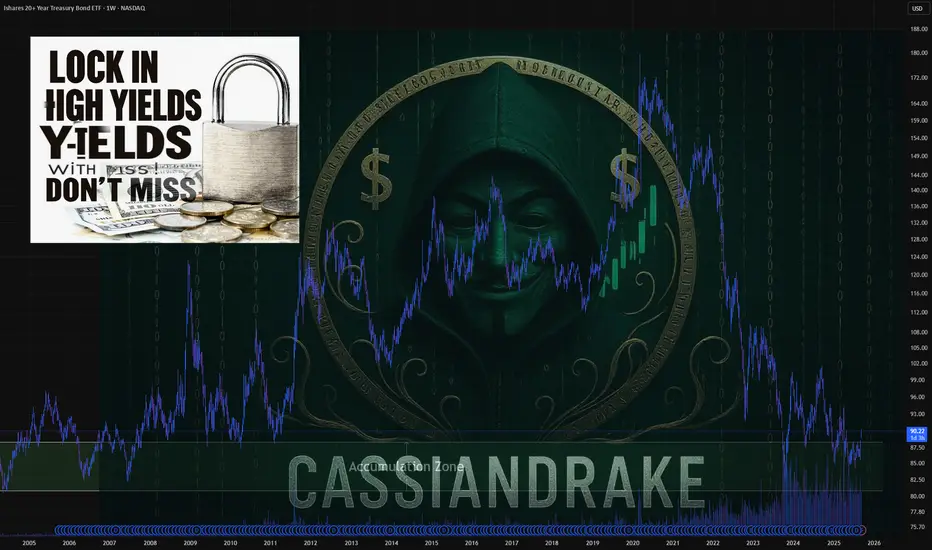
Why Now is the Best Time to Load Up on T-BillsIn 2025, investors have a unique opportunity to capitalize on high yields from Treasury Bills (T-Bills) as interest rates hover at their highest levels in years. With indications that the Federal Reserve may soon start cutting rates, now could be the ideal time to invest in T-Bills through the TLT ETF. This article explores why investing in T-Bills now could reap significant returns over the next decade.
Key Points:
Highest Interest Rates in Years:
Current interest rates on T-Bills are elevated, offering attractive yields for investors.
Historical data shows that such high yield opportunities are rare and may not be seen again for years.
Federal Reserve Rate Cut Expectations:
The Federal Reserve has signaled potential rate cuts due to concerns about job market stability and inflation trends.
Market expectations suggest that rate cuts may begin later in 2025, which could reduce yields on T-Bills in the future.
Strategic Advantage of T-Bills:
Investing now allows investors to lock in current high yields before potential rate cuts reduce returns.
T-Bills offer a safe investment with guaranteed returns, backed by the U.S. government, making them a low-risk option.
Why TLT ETF?
The TLT ETF provides exposure to long-term Treasury securities, making it an excellent vehicle for capitalizing on current high yields.
The advantages of using an ETF include ease of trading and diversification.
Conclusion:
With interest rates at a peak and expectations of future rate cuts, now is a strategic time to invest in T-Bills via the TLT ETF. By taking advantage of the current high yields, investors can secure returns that may not be available again for years to come.
TVC:DXY NASDAQ:MSTR TVC:GOLD TVC:SILVER BITSTAMP:BTCUSD $VNIDIA NASDAQ:TSLA VANTAGE:SP500
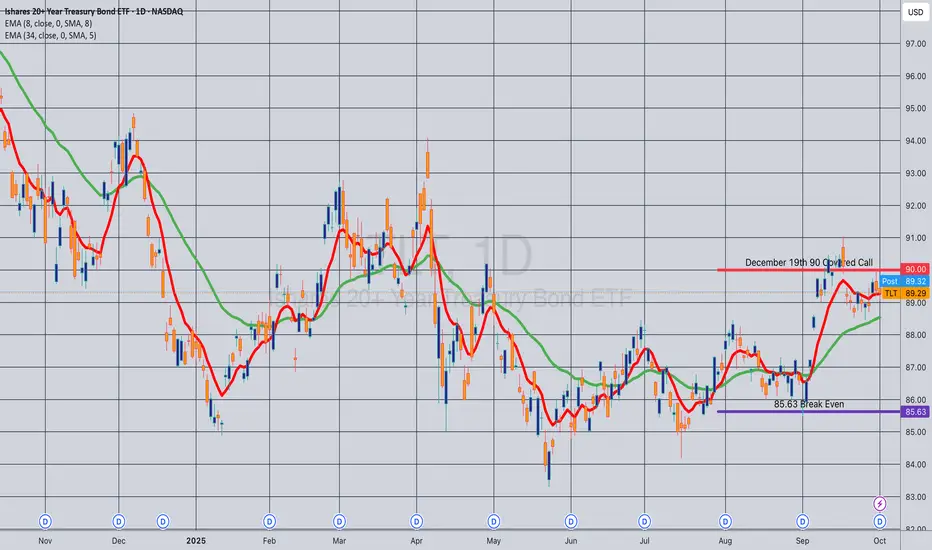
UPDATE: TLT December 19th 90 Covered CallsThis is a continuation of a long-running TLT covered call setup that I started out in April of 2025 (See Post Below) with my current break even shown which I'm doing an update on.
I've generated 6.50 ($650) in free cash flow to date in short call premium + dividends on a buying power effect that was a 92.13 debit/contract when I opened it.
Sitting on my hands here, waiting to roll out the short calls when they're in profit or alternatively to take profit on the setup at or near max and then reset.
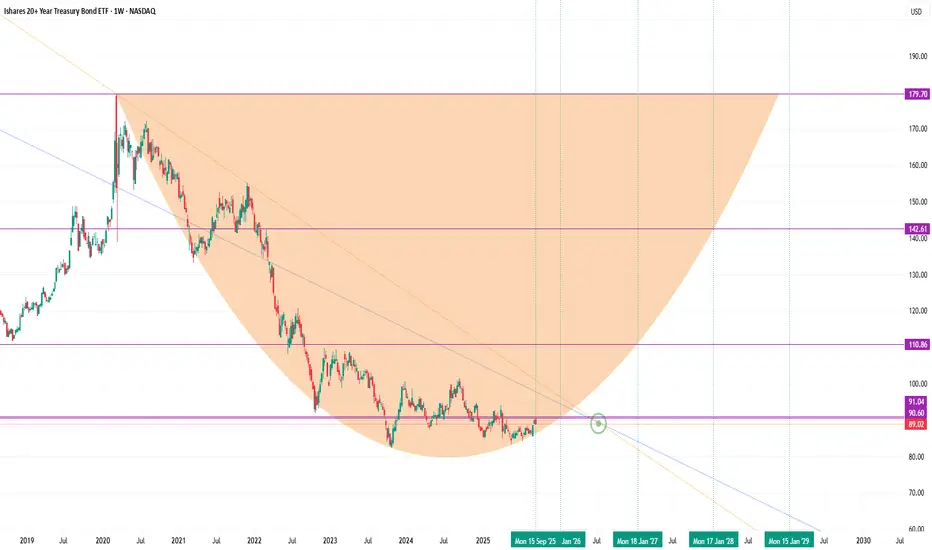
TLT current levels and possible way forwardSetup an arc as a potential forecasting tool to model the future price action of the TLT 20 year treasury bond.
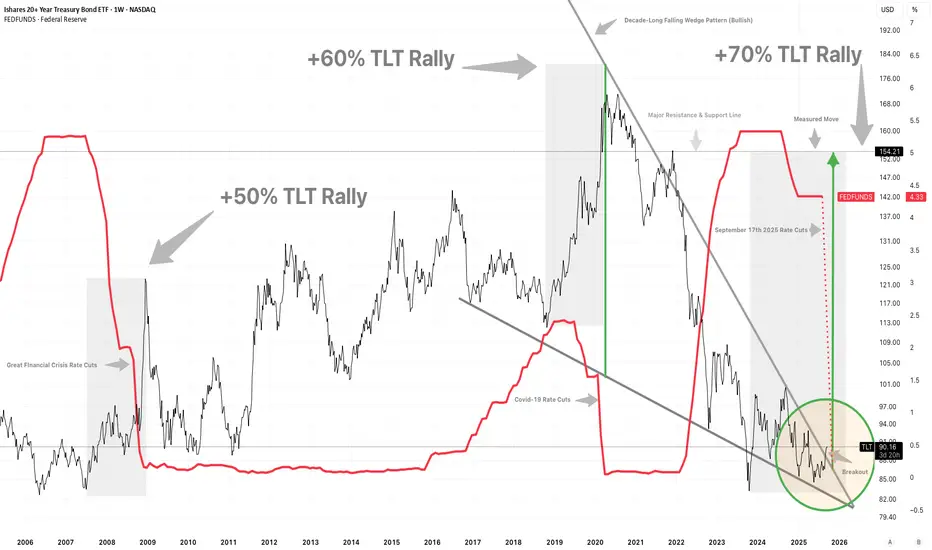
TLT to 110 as FED cut cycle beginsExtended duration bond proxies like TLT are trading at all time lows due to the high interest rates in the US the last few years. With the FED turning dovish, and labor market starting to crack, this trend is likely to reverse. TLT is a good bet here, more leverage can be gained with a 3x ETF like TMF.

TLT TimeRate cuts start this Wednesday, September17th, 2025.
Polymarket odds are now strongly in favor of 3 rate cuts in 2025. CME Fedwatch probability is now at 70% for 3 cuts by December 10th.
Economic data, especially employment, has strongly confirmed the start of a full rate-cutting cycle beginning in 1.5 days.
Historically this set of circumstance has coincided with large or even historic bond rallies.
Will this time be different?
Long TLT/SPY📌 Bonds Explained: What They Are, How They Work & Key Risks
Bonds are one of the oldest and most important financial instruments in global markets. They are used by governments, corporations, and institutions to raise money, and by investors to earn income, diversify portfolios, and manage risk.
At their core, a bond is a loan:
The issuer (borrower) raises capital by selling bonds.
The investor (lender) provides money in exchange for periodic interest payments (coupon payments) and the return of the principal (face value) at maturity.
🔹 1. What is a Bond?
When you buy a bond, you are lending money to the issuer. The issuer promises:
Interest payments (usually fixed) on a regular schedule (semiannual or annual).
Repayment of principal (the original investment amount) when the bond matures.
📌 Example:
You invest $1,000,000 in a 10-year bond paying 3% annually (semiannual coupons).
Every 6 months, you receive $15,000 in interest payments.
At the end of 10 years, you (hopefully) receive back your original $1,000,000 principal.
🔹 2. Why Do Companies and Governments Issue Bonds?
Governments → Fund infrastructure, social programs, defense, or refinance existing debt.
Corporations → Finance expansion, research, acquisitions, or refinance loans.
Municipalities → Build schools, hospitals, and roads.
Bonds allow issuers to access large pools of capital without giving up ownership (like stocks).
🔹 3. Why Do Investors Buy Bonds?
Stable Income: Regular coupon payments.
Capital Preservation: Return of principal at maturity (assuming no default).
Diversification: Bonds often behave differently from stocks, balancing risk.
Hedging Inflation/Interest Rates: Certain bonds (like TIPS) protect against inflation.
Relative Safety: High-quality government bonds are considered safe-haven assets.
🔹 4. Key Types of Bonds
Government Bonds
Issued by sovereign states.
Example: U.S. Treasuries, UK Gilts, German Bunds.
Generally low risk, lower yields.
Corporate Bonds
Issued by companies.
Higher yields than government bonds but higher risk.
Municipal Bonds
Issued by local governments or agencies.
Often come with tax benefits for investors.
High-Yield (Junk) Bonds
Issued by lower-credit issuers.
Higher potential returns, but much riskier.
Inflation-Protected Bonds
Coupon/principal linked to inflation.
Example: U.S. TIPS (Treasury Inflation-Protected Securities).
🔹 5. Three Main Risks of Investing in Bonds
Even though bonds are often seen as “safe,” they carry risks that investors must understand:
1️⃣ Credit Risk (Default Risk)
The issuer may fail to pay coupons or repay the principal.
Higher with corporate bonds and emerging market government bonds.
Mitigated by credit ratings (Moody’s, S&P, Fitch).
📌 Example:
If a company defaults, you may lose part or all of your investment.
2️⃣ Interest Rate Risk
Bond prices move inversely to interest rates.
If rates rise, existing bond prices fall (since new bonds offer better yields).
If you sell before maturity, you could face a loss.
📌 Example:
You bought a 10-year bond at 3%. A year later, rates rise to 5%. Your bond’s market value falls, because investors prefer newer bonds paying higher coupons.
3️⃣ Inflation Risk (Purchasing Power Risk)
Even if you hold the bond to maturity, rising inflation erodes the real value of your returns.
A 3% coupon loses attractiveness if inflation rises to 6%.
📌 Example:
Your bond pays $30,000 annually, but inflation pushes up costs by $40,000 per year → you are effectively losing purchasing power.
🔹 6. Bonds vs. Stocks
Bonds: Debt, fixed income, contractual obligation, lower risk, limited upside.
Stocks: Equity ownership, dividends (optional), higher risk, unlimited upside.
In a company bankruptcy, bondholders are paid before shareholders.
🔹 7. How Investors Use Bonds in Portfolios
Income generation: Retirees and pension funds rely on coupon payments.
Diversification: Bonds often rise when stocks fall, reducing portfolio volatility.
Risk management: Safe-haven bonds (like Treasuries) act as “insurance” during crises.
Speculation: Traders can bet on interest rate moves via bond futures and ETFs.
🔹 8. Bonds vs. Stocks: The TLT–SPY Correlation
One of the most widely followed relationships in global markets is the correlation between:
TLT → iShares 20+ Year Treasury Bond ETF (tracks long-dated U.S. Treasury bonds).
SPY → SPDR S&P 500 ETF (tracks U.S. equities).
📈 Historical Relationship
Over the past two decades, TLT and SPY have often moved in opposite directions. (The Correlation between SPY/TLT often hovers around 0.)
Why? When stocks sell off, investors typically seek safety in Treasuries, pushing bond prices up (yields down).
This negative correlation makes bonds a powerful diversifier in equity-heavy portfolios (60/40).
📌 Example:
2008 Financial Crisis → SPY plunged ~37%, while long-dated Treasuries (TLT) surged as investors fled to safety.
March 2020 COVID Crash → SPY fell ~34% peak-to-trough, TLT spiked ~20% as the Fed cut rates and investors piled into Treasuries.
🐂 Strategy #1 (MA):
Buy SPY when TLT crosses below the 95 MA.
Sell SPY when TLT crosses above the 95 MA.
🔄 But the Correlation Can Shift
In inflationary environments, bonds and stocks can fall together.
2022 is a perfect example:
Inflation spiked → Fed hiked rates aggressively.
TLT dropped ~30% (yields surged).
SPY also fell ~19%.
Both asset classes sold off simultaneously, breaking the hedge.
🐂 Strategy #2 (Re-Balancing):
Buy TLT at the close of the seventh last trading day of the month.
Sell TLT at the close of the last trading day of the month.
Sell TLT short at the close of the month.
Cover TLT at the close of the seventh trading day of the month.
Higher Returns after rate hikes.
📊 Why This Matters for Investors
In normal times: TLT acts as a counterweight to SPY, smoothing portfolio volatility.
In inflationary shocks: Both can decline, reducing diversification benefits.
Lesson: Don’t assume bonds will always hedge equities — context (inflation, Fed policy, growth cycles) matters.
📌 Practical Uses of the TLT–SPY Correlation
Portfolio Diversification
A 60/40 portfolio (60% stocks, 40% bonds) relies on the negative correlation.
Works best when inflation is low and stable.
Risk-On / Risk-Off Gauge
If both SPY and TLT rise → markets are calm, liquidity flows into both risk and safety.
If SPY falls while TLT rises → classic risk-off move (flight to safety).
If both fall → inflation or policy tightening environment (no safe haven).
Trading Signals
Divergence trades: When SPY rallies but TLT also rallies strongly, it may signal equity rally exhaustion (risk-off brewing).
Macro hedge: Long TLT positions can offset downside risk in SPY-heavy portfolios — but only in disinflationary or deflationary shocks.
🔹 9. EWJ–TLT Correlation: Japan Equities vs. U.S. Treasuries
EWJ → Tracks Japanese equities (large & mid-cap companies).
TLT → Tracks U.S. long-dated Treasuries.
Unlike the classic SPY–TLT inverse correlation, the EWJ–TLT relationship is more complex, shaped by:
Global risk sentiment (risk-on/risk-off flows).
Currency effects (USD/JPY exchange rate).
Japan’s ultra-low interest rate environment (BoJ policy).
📈 Historical Tendencies
1️⃣ Risk-Off Periods (Global crises → flight to safety):
TLT rallies (U.S. Treasuries bid).
EWJ often falls, as Japanese equities are highly cyclical and export-driven.
Negative correlation dominates.
📌 Example:
2008 Crisis → TLT surged; EWJ plunged with global equities.
2020 COVID Crash → Same pattern: safety flows to Treasuries, Japanese stocks sold.
2️⃣ Risk-On Periods (Liquidity, global growth optimism):
EWJ rallies with global equities.
TLT may drift lower (yields rising on stronger growth).
Correlation weak to moderately negative.
📌 Example:
2016–2018: Global growth rebound → EWJ rose, TLT fell as U.S. yields climbed.
3️⃣ Currency Channel (USD/JPY)
Japanese equities (EWJ) are sensitive to the yen.
A stronger USD/JPY (weaker yen) boosts exporters (good for EWJ).
TLT rallies often coincide with USD weakness (yields down, dollar down), which can hurt Japanese exporters, adding another layer of inverse correlation.
🔄 Shifts Over Time
Long-term average correlation: Mildly negative (similar to SPY–TLT, but weaker).
During inflation shocks (2022): Correlation turned positive at times:
TLT fell as U.S. yields spiked.
EWJ also struggled due to global tightening & yen weakness.
Both moved down together, breaking the hedge.
📊 Why EWJ–TLT Matters
Global Diversification Check: Investors often think Japanese equities diversify U.S. equities, but they can be just as cyclical. Adding TLT creates the real hedge.
Risk-Off Signal: When both EWJ and TLT rise, it may indicate global liquidity easing (rare but bullish).
Currency Overlay: Always factor USD/JPY → sometimes EWJ’s move is more about currency than equities.
🐂 Strategy #3 (EWJ):
When Japanese stocks are above their 150-day moving average, go long TLT (US long-term Treasury). When the average is below the 150-day average, stay out. The correlation between TLT and EWJ can serve as a breath signal.
📌 Conclusion: Bonds as the Foundation of Finance
Bonds are the backbone of the global financial system, connecting borrowers (governments, corporations) with lenders (investors).
✅ Bonds provide regular income and capital preservation.
✅ They carry risks: credit, interest rate, and inflation.
✅ They are essential for diversification and risk management.
✅The TLT–SPY correlation is dynamic. Historically negative, providing diversification. In inflationary shocks (like 2022), the correlation turns positive, breaking the hedge.
✅ EWJ–TLT is a Global Macro Hedge, But Fragile. Usually inverse: Risk-off = TLT up, EWJ down. Sometimes aligned: Inflation shocks or synchronized global tightening → both down. Currency filter essential: USD/JPY often mediates the relationship. This makes EWJ–TLT correlation a powerful barometer of global macro regimes: Disinflationary slowdowns → Strong hedge. Inflationary crises → Hedge breaks.
For investors, understanding bonds is crucial, even if you primarily trade equities or commodities, because bond yields influence everything: stock valuations, mortgage rates, and even currency markets.

Opening (IRA): TLT November 21st -83P... for a 1.02 credit.
Comments: Looking to pick up additional shares at 83 or below. Targeting the strike and duration that pays around 1% of the strike price in credit.

TLT Long Here or CloseI expect TLT to rally this summer since rate cuts are more likely then not
TP1 91
TP2 96

$TLT bull run is beginning; Top trade idea for 2026- Anticipated Federal Reserve Rate Cuts are coming. People think for the good reason but it is actually for the wrong reason. Fed is too late !
- Treasury yields are falling after being stubborn for years
- NASDAQ:TLT would be safe haven for the recession we are tipping into 2026
- Market is all time high with la laland spending by Big Cap Tech stocks because of AI

$TLT Monthly Uptrend Signaled for 16 MonthsThe simple trend-following and trend-timing and trend-targeting method I call "Time@Mode" is generating a new signal as of this week.
The signal is created when the range this month is up by more than last month's range, which is called a "Range Expansion Month".
The mode becomes the measuring launchpad for the move and the range around the mode is the measuring stick.
Projecting up to nearly 103 by January 2027 is a greater than 15% gain from current levels.
We need to see the entire month of September hold this gain, but it is acceptable to take a trade prior to the bar (Month of September) closing.
The risk is a move back under the mode.
Tim
9/9/2025 10:54AM EST

TLT weekly bullish engulfing amid increasing unemployment reportBullish argument:
Double monthly volume spike at approx 85$ support level
Weekly double bottom
Friday daily pump amid increasing unemployment rate report
Closed weekly bullish engulfing or bullish three line strike signaling beginning of a potential uptrend
Bearish arguments:
Bonds are known to move super slow percentage wise.
Conclusion: The weekly bullish engulfing amid unemployment rate uptick most likely signal the beginning of a bull market for bonds as central banks will react to this news by starting to lower interest rates to stimulate house purchases and manufactured goods that comes allow with owning houses which will increase job demand.

Opening (IRA): TLT Sept 19th 83 Short Put... for an .88 credit.
Comments: Camping out with a strike slightly below the 52-week low, where the options contract is paying a smidge more than 1% of the strike price in credit.
I don't really need more TLT, but wouldn't mind being assigned more at a lower price than the stock element of my covered calls.

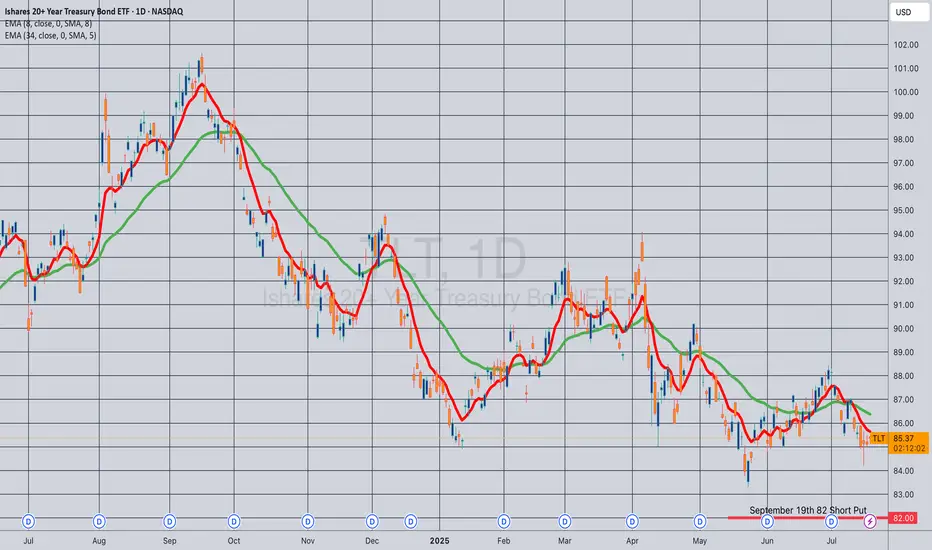
Opening (IRA): TLT September 19th 82 Short Put... for a .90 credit.
Comments: Adding to my position at strikes slightly better than what I currently have on ... .
Rates Coming Down?TLT could be a great trade here. I'm seeing signs that the low could be in. The RSI is coiling up and piercing the downtrend. We are also climbing above the 21 Week Moving average, which is has been firm resistance since the rate hiking cycle.
Bond yields are tanking, employment is weakening, pressure is building on rate cuts from the highest level. TLT could be a beneficiary.
Not financial advice, do what's best for you.

TLT LongThe broader market structure on the TLT 1D chart shows a clear downtrend, followed by a Change of Character (CHoCH) when price broke above the lower high near $86.50, signaling a potential trend reversal. This CHoCH is further validated by a strong push off the demand zone around $83–$84, where buyers stepped in with conviction, leading to a series of higher lows and an emerging bullish structure.
The demand zones below, especially the wide green area near $82.68–$84, are strong; price previously reversed sharply from this level, indicating institutional interest. In contrast, the supply zones between $88–$93 appear layered and moderately strong, especially around $88.20 and $92.70, where price previously sold off. However, the lack of deep wicks and clean rejections in the lower supply zones suggests that sellers may be weakening.
Currently, price is pushing upward toward the $88–$89 zone with bullish momentum. Within the marked region, price is climbing steadily after forming a minor higher low. If it can break above $88.20 convincingly, the next logical target would be the supply near $92.70–$93. A minor pullback to the $85.50–$86 zone could offer a buying opportunity if demand holds.
The trade bias is bullish with an expected continuation toward $92.70, assuming momentum holds. Invalidation of this outlook would occur if price breaks back below $84.00, which would indicate a failed breakout and potential return to the broader bearish trend. Momentum currently favors buyers, with higher closes and strong-bodied candles confirming upward intent.

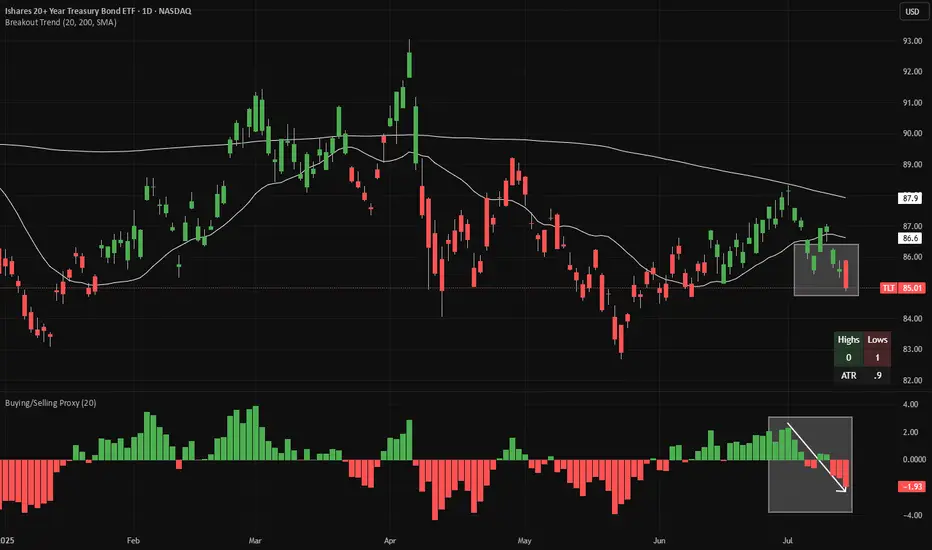
TLT short - warning signs from JapanTLT is making 20-day lows (red candles in the main chart), while continuing to make 20-week lows on a weekly chart (not shown). Meanwhile, looking at a proxy of net buying/selling (bottom panel), we have flipped from buying to selling.
Looking at Japanese bond yields, 10-year JGBs (JP10Y) just broke out of tight range. This is the third attempt to trade above ~1.59% recently, which we saw earlier today. As Japan's is one of the world's leading overseas investors, this is an obvious warning sign for bonds globally.
There is good risk/reward to short bonds here, with a stop-loss if the price closes at a 20-day high. If a 20-day high is made, the candles will change color from red to green.
Both indicators (Breakout Trend and Buying/Selling Proxy) are available for free on TradingView.