SHARDACROP trade ideas

Sharda Cropchem Reversal TradeThe stock has reached lower trendline and may undergo a reversal rally. Trade is supported by brokerage calls and Supports Nearby.
Risk Reward Ratio - 2.5:1
SL is placed below support zone & the lower trendline. The target is placed near resistance.

SHARDA CROPCHEM (LONG)it has taken support twice near 300.
Buy @ 300 - 315
Tgt 342 - 370
SL 283
may face small resistance near 328
short term traders can play from 318 to 328
positional type can hold till 342 - 370
Please correlate yourself also on charts. this is for educational purpose only. must consult with your financial advisor before investing.

Big Upside is dueGreat accumulation is going on in the stock. Should double to 600 in less than a year. A good fundamental stock where the upside is due.

SHARDACROP, entering into correction, longterm target around 420Completed 5 waves move up meaning, prev monthly downtrend ended.
Now, entering into correction, before moving up.
Upward trend started

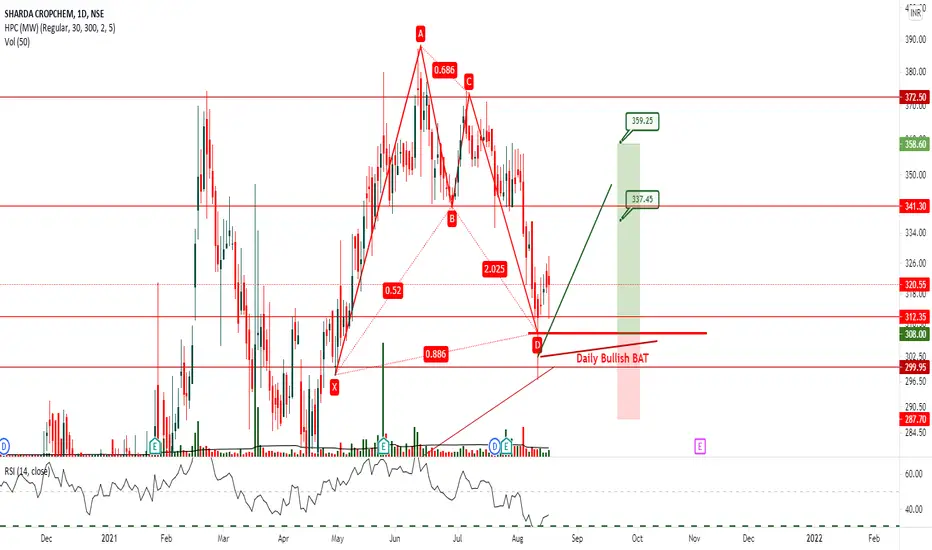
SHARDACROPCHEM 4HRConfluence of Daily & 4HR BULLISH Bat with BULLISH DEEP CRAB LEVELS. STRONG POTENTIAL REVERSAL ZONE
Price need to follow GREEN TREND LINE and hit Target 1 & 2 , else if Price BREAKS RED TREND LINE is EXIT
POTENTIAL BUY

SHARDACROP DAILYBullish Bat
Price need to follow GREEN TREND LINE and hit Target 1 & 2 , else if Price BREAKS RED TREND LINE is EXIT
POTENTIAL BUY
Sharda Cropchem swing390 will be a tough level to close
if happens 500 levels will be open for coming months


SHARDACROP - Multiple Patterns breakout - Swing TradeThe above analysis is done purely based on price action and chart patterns.
The analysis is done on daily TF hence price may take few days to few weeks in order to reach the targets
Logic as well as the trade setup is shown in image itself.
Entry can be made between the range of 285-295. SL and Targets are shown in image itself.
The above analysis is purely for educational purpose. Traders must do their own study before entering into any trade. Traders must trade as per their own risk taking capacity and money management.
Feel Free to comment for any queries regarding the above stock or price action analysis in general.
Also check out my other ideas to understand how price action works and how it can be used to make regular profits without any complex strategies.

Sharda Cropchem having a nice long setupSharda Cropchem a debt free and consistent performing agrochem company bouncing off the support, may reach 345 and then 419, sl: 250. Also it is forming inverse head and shoulder pattern with neckline around 300.
Disclaimer: The stock/index/currency discussed do not constitute Investment/trading advise and is merely an effort towards enhancing learning, knowledge and book keeping. Kindly do your own due diligence and/or consult investment advisor before making any investment/trading decisions

Shardacrop chem forming Higher HighsShardacrop chem is continuing to make higher high and if closes above 325 level on daily basis it can rally upto 375-420 levels.

Sharda Cropchem Breakoutsharda Cropchem has taken a breakout from weekly Channel.
Now heading for Next target.


