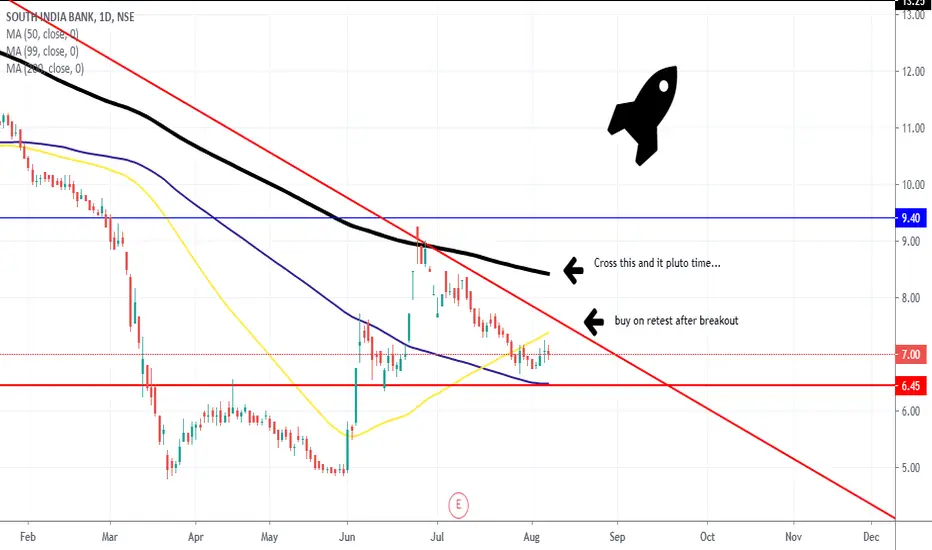
South Indian Bank One can buy keeping all below trendline,
Low rish high reward trade
Could be multibagger
SOUTHBANK trade ideas

Long call for South Indian BankAs the chart forms a falling wedge pattern, will it break out? The fibonacci retracement levels can be used to identify the key levels of support. RSI and MACD support the change of reversal!
Have a good trade ahead!!!!!!!!!!

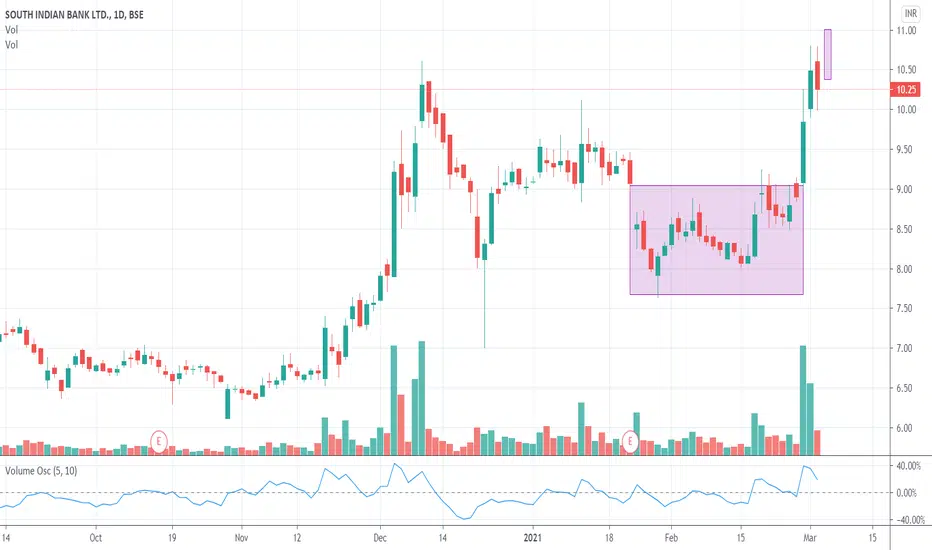
SOUTH INDIAN BANK BULLISH BUTTERFLY Hello
Welcome to this analysis about SOUTH INDIAN BANK , we are looking at daily timeframe perspectives. SOUTH INDIAN BANK is developing here that will be a decisive factor in the upcoming times. I discovered the main formation SOUTH INDIAN BANK is developing here that will be a decisive factor in the upcoming times. As when looking at my chart now we can watch there how SOUTH INDIAN BANK has emerged with this key channel pattern & Bullish Butterfly pattern marked in my chart with boundaries. which is an important level and also psychological level mark together with the lower-boundary of the channel-formation a pullback
In this manner, thank you for watching my update-analysis about SOUTH INDIAN BANK and its major channel-formation with the determining factors we need to consider in upcoming times, support the analysis with a like and follow or comment for more market insight!

RRR IS = 2.37 TACK A TRAD AND HAVE FUN This is a descending triangle pattern. Please take a trade after brackout. Set stop loss .

SOUTH INDIAN BANKSouth India Bank-CMP Rs. 11.40-Stock crosses 0 Line and since than Trading volumes are good and delivery volumes are also good, stock is about to give a break out, BUY the stock at current price on dips till 11 Rs. with a stop loss of 10.30 on closing basis for the target of Rs. 12.50/13.50/15 in next 1-3 Months.

Time To Accumulate This StockKeep In Radar Crossing Moving Average With a Good Volumes God Bet To Buy

Circuit increase 20% circuits revised has to be for some reason wanted to do this earlier but never got around to it...
looks good to buy levels on chart...


#southbank - Buy? - NOT YET MACD suggests a Bounce soon but I will wait for weekly close before entering, I still think one more leg down is in cards. I will update in timeline

southindian bank research, flag pattern if up target is 33 else southindian bank research, flag pattern if up target is 33 else negative pole height
monthly chart


short term bullish ( in conslidation phase)short therm bullish and rsi 14 divergence in daily chart and MACD divergence in 4 hours chart
enter the market above 23.65
keep a stop loss at 23.10
long term bearish
not a holding stock
( enter the market with 1 hour chart)


Bullish Cypher on the SouthIndian BankNSE:SOUTHBANK
Weekly support pivot and resistance mentioned
The cypher is yet incomplete
Take profit is set at 0.618CD of the cypher, which is also the resistance band of the kumo cloud
Disclaimer.. this is not an investing/trading advice

South Indian Bank seems to go HighAll details in Chart. If price break the R line, it may goes to high.


