BTC.D next short term move
Hi everyone
BTC.D has already been on a correction from 57 to 60 meanwhile could also make wicks above 62. There it faced with a rapid push back below 60 and now playing hard with old trendline.
In summary dominance is looking at 57 for next leg down!
Trade ideas

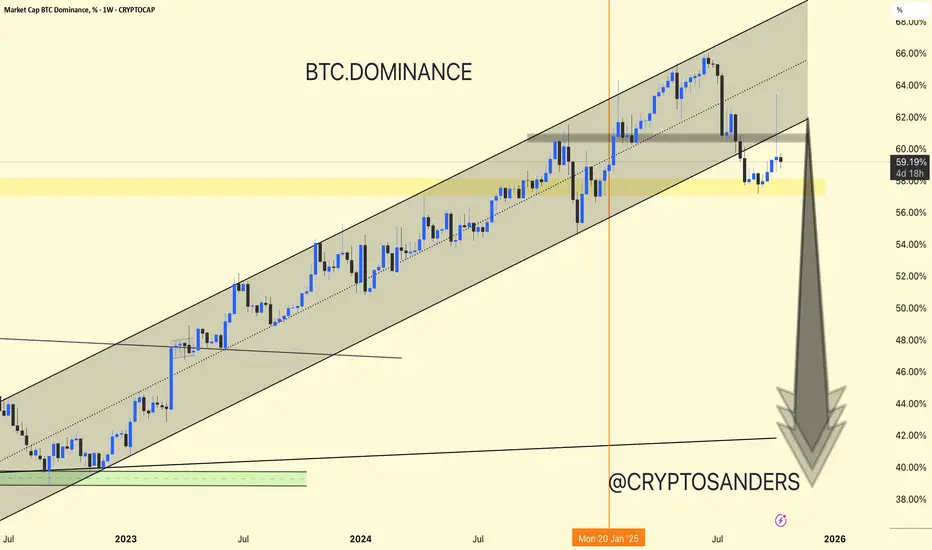
Chart Overview (BTC.D – Weekly Timeframe). Chart Overview (BTC.D – Weekly Timeframe)
Current Level: ~59.24%
Trend: BTC dominance is still moving within a long-term ascending channel, but recently retested the lower boundary after encountering resistance around 64-65%.
Retest of Rising Channel Support:
BTC dominance touched the lower trendline of the ascending channel and found short-term support near the 58% area (marked in yellow).
Resistance Area (60-62%)
The chart shows a gray resistance area where dominance was previously rejected. This area is crucial for confirmation.
If BTC.D does not close above this, we could see further downside movement.
Potential Downside Ahead:
The large downward arrow indicates a potential correction phase, targeting the 50-45% dominance levels – a scenario that typically benefits altcoins (altseason signal).
Support Zone: 56-58%
Resistance Zone: 60-62%
Potential Downside Target: Around 45%
Trend Structure: Still bullish in the long term, but bearish momentum is possible in the short term.
If BTC dominance decreases, it means altcoins could strengthen.
If BTC dominance increases again, Bitcoin will continue to outperform altcoins.
BTC dominance is strengthening after a long bullish run.
If it fails to reach 60-62%, a trend toward altcoins is expected in the coming weeks.
DYOR | NFA
#BTC.D 12H ChartBitcoin dominance bounced again after retesting the support line. It is currently retesting the resistance line which, if broken, we would expect further bullish movements towards the 200MA.
BTC Dominance Technical & Fundamental OverviewDescription:
Bitcoin Dominance (BTC.D) represents the market share of Bitcoin relative to the total cryptocurrency market. Tracking BTC.D can help identify trends in altcoin cycles and overall market sentiment. This analysis combines technical patterns, support/resistance levels, and relevant market fundamentals to provide an informed perspective.
Disclaimer:
This content is for educational purposes only and does not constitute financial advice. Trading cryptocurrencies involves significant risk. Always perform your own research before making any trading decisions.
Hashtags / Keywords:
#BitcoinDominance #BTC #CryptoMarket #TechnicalAnalysis #CryptoTrading #AltcoinSeason #MarketTrends #BTCAnalysis #CryptoEducation #TradingView
Altseason on the Horizon?Technically, BTC Dominance has retested the breakdown of the rising channel, confirming a clean rejection from the retest area.
If price manages to break below the current support zone, we could see a strong shift toward altcoins as capital starts rotating out of BTC.
This recent move also flushed out over-leveraged traders, resetting market positioning, a healthy sign before the next major leg.
Stay patient and always analyze your risk before entering any position. The next few weeks could be decisive for the altcoin market.
DYOR, NFA
Stay tuned for more update
THANKS FOR THE READING
#PEACE

Btcd This is the first test on the 200 ma
Keep a eye on it
I know last Friday seem tragic
But stay locked in

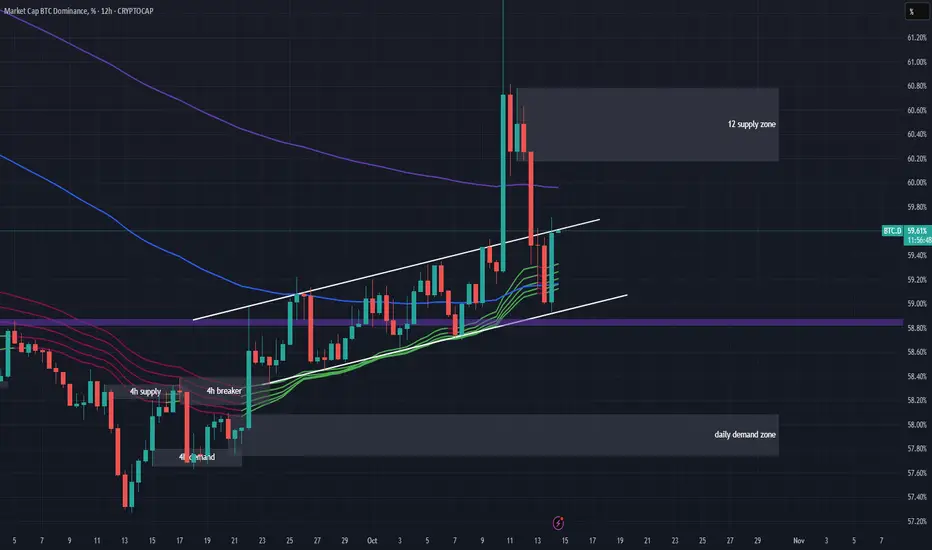
#BTC.D 12H ChartBitcoin dominance did a sweep to the upside and left a 12h supply zone at around 60.3%. It is currently back inside its previous range where it is bouncing off the 100MA. If it breaks above the resistance line again, we shall see some short-term bullish movements towards the 200MA.

BTC Dominance - Not since May 2020 has this happened - Oct 2025On the top half of the above 11 day chart Bitcoin dominance is shown with the OTHERS market capital total below.
Bitcoin dominance: a ratio of Bitcoin market cap to cumulative market cap of other cryptocurrencies.
OTHERS market capital: The total market capitalisation of the top-125 cryptocurrencies, excluding BTC and some other top cryptocurrencies (typically Bitcoin, Ethereum, XRP, BNB, all overbought at the moment, and stable coins).
The subject of Bitcoin dominance was brought to my attention from a follower who asked:
“Ww, Benjamin Cowen say’s Bitcoin dominance is about to explode upwards in October, do you agree?”
If you don’t know who Benjamin is, get your Youtube out.. he’s a self made authority on Bitcoin technical analysis. In the last two videos there’s a strong call for an increase in Bitcoin dominance.
Do I agree? No.
Like Ben, I’m a statistician by trade. There’s Lies, damn lies, and statistics.
The story
Bitcoin dominance has done something not seen since May 2020. It has entered the Gaussian channel. It was the same condition that allowed the publication of the idea below for a dominance surge to 70% (now closed).
What has confirmed? Broken market structure. Is that simple.
Support and resistance must receive your full attention when betting on markets. So many folks ignore simple facts of the chart, betting before confirmation. I’m surprised this escaped Ben’s attention. But in fairness, I'm spending a lot of time on charts and not so much on video content!
Why 11 day? Pro tip: the market chooses the timeframe, not you. Always choose a timeframe that matches pivots in the market with what tools you're using.
What next?
Look left. Once dominance has entered the channel, a test of the lower side is almost inevitable, which is currently 54%. After a bounce there’s a high probability dominance continues to fall until 48%.
Compare and contrast previous collapses in Bitcoin dominance with the OTHERS market total shown in the bottom half of the chart. The market cap saw impressive gains.
Now I can already hear the calls “Alt season”, not so fast.
There are 23 million tokens. They are not all going to rally, there's just not enough money in the world for that to happen. In fact many will correct during this period, you have to be selective.
Conclusions
Bitcoin dominance entering the Gaussian channel is not a bullish event, it’s a structural warning. The last time this occurred was May 2020, and what followed wasn’t a Bitcoin surge, but a capital rotation into the broader crypto market. Even still Bitcoin price shall continue to rise.
Broken market structure is confirmation enough. Once dominance enters the channel, the lower boundary (currently ~54%) tends to act as a magnet before any meaningful bounce. History suggests a continued decline toward 48% is probable, a range that has previously aligned with strength across selective alt coins.
This doesn’t mean “alt season” in the influencer sense. The market isn’t about to lift 23 million tokens. It means opportunity will shift, and those with patience to identify strength, not just narrative, will benefit most.
In short, Bitcoin dominance may have topped for now. The focus should move from prediction to confirmation, from generalisation to selection.
The market has already chosen its timeframe. Now it’s choosing its winners, are you're positioned to benefit?
Ww
Bitcoin dominance long idea May 2022
Disclaimer:
This post is for educational purposes only and reflects my personal opinion, not financial advice.
Always do your own research, manage risk, and make decisions based on your own strategy and timeframe. Markets reward patience, not predictions.

Welcome to the altcoin rally!Now that the long-awaited “re-test” has happened, are you ready for a short but highly impactful altcoin rally?

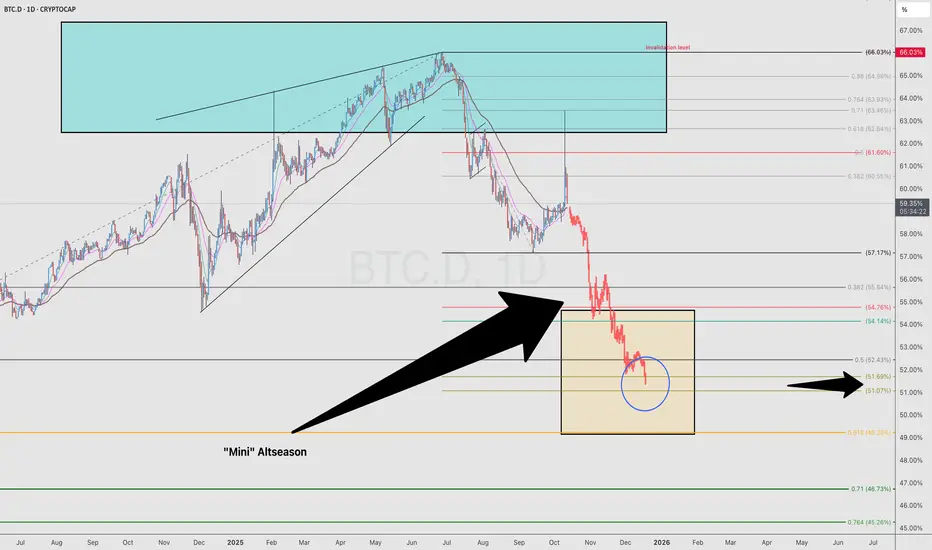
BTC.D 1D – Altseason on the HorizonHi fellow traders,
On the 1D BTC.D chart, I am applying Elliott Wave principles and broader market structure to highlight a potential move down toward the 51.7% dominance level. This zone aligns perfectly with the 0.5 Fibonacci retracement and could mark the next key turning point for Bitcoin dominance.
If this scenario plays out, we may witness a “mini” Altseason — a phase where capital begins rotating out of Bitcoin and into altcoins, sparking stronger rallies across the broader crypto market.
This setup isn’t a trade but a macro expectation, and it could serve as a powerful signal for increased altcoin strength in the coming weeks.
Stay alert — things could get very exciting from here.
Good luck and trade safe!
BTCD Here’s some hopeium on this beautiful Sunday.
As you see this is where we started alts going crazy in Q424.
Alts just had a major reset.
While BTC at ATH . The shake out was real
But this is why we don’t use leverage
Just stack and chill till it’s your time for your alt.

Altseason has just kicked in!Take a look at the Bitcoin dominance chart — the diagonal pattern is breaking down and we’ve just had the classic goodbye kiss to the downside.
Enjoy the season!

Bitcoin Dominance Trend Line Broken The breaking of this trend line suggests further downsides are coming for dominance BTC
Alts will be moving more than BTC as they gain dominance relative to it
Altszn after this massive dump
1day chart

More slowly.Another chart about how it's pointless to look at a situation using 4 H, 1 D, or even 1 W.
What are you guys talking about?
When will this monthly divergence finally materialize?
Wait, wait and wait.

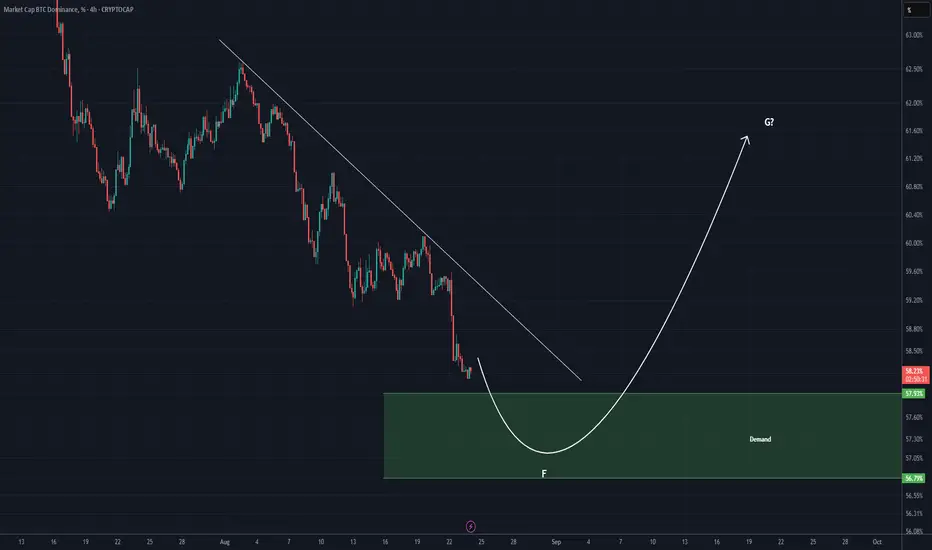
BTC DOMINANCE Update (4H)This analysis is an update of the analysis you see in the "Related publications" section
As expected from the previous analysis, we anticipated a drop in this index, and the drop is currently in progress.
One important point to note is the green zone, which is a strong support area. It is possible that the diametric/symmetrical structure we discussed in earlier analyses is still intact. In that case, wave F of this diametric pattern may complete in the green zone, and candles could then enter wave G | a bullish wave that may trigger a significant correction in altcoins.
For risk management, please don't forget stop loss and capital management
When we reach the first target, save some profit and then change the stop to entry
Comment if you have any questions
Thank You
$BTC.D Head and Shoulders + Death CrossWho remembers when I put out this Head & Shoulders idea for CRYPTOCAP:BTC.D September 2nd? 🤓
On the verge of the 20 / 50 WMA Death Cross ☠️
This SHOULD be the top for ₿itcoin Dominance.
Does not mean that it won't float around here for a few weeks tho 🫶

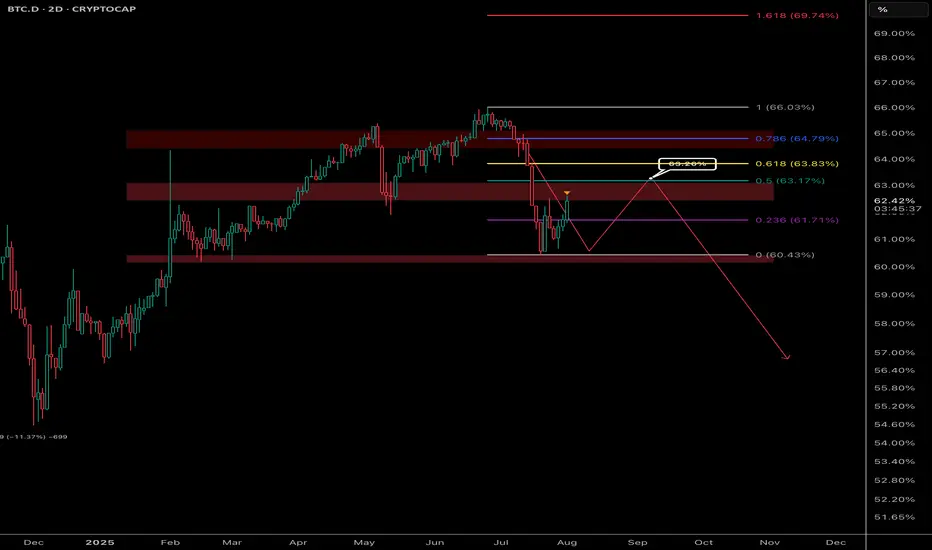
Bitcoin Dominance (BTC.D) – Key Levels Ahead
BTC dominance is climbing into a major resistance zone after a steep drop. The current structure hints at a possible lower high forming, which could be bearish if it gets rejected around 63.2%.
🟥 If rejected from resistance:
Could mark a continuation of the downtrend in BTC dominance.
This may signal money rotating out of BTC and into altcoins — potential altseason vibes ahead.
🟩 If it breaks above:
The dominance trend may continue higher.
That would indicate capital flowing back into BTC, possibly showing risk-off sentiment or market uncertainty.
🎯 Key zones to watch are where dominance stalls or breaks — market rotation depends on this move.
When will ALT season start? BTC Dominance PredictionWhile there is no way of knowing when exactly ALTS will start moving, certain patterns in the chart show that this may happen based on how quickly/slow BTC dominance will decline. That will determine the angle where the BTC dominance will hit around 40%. My guess is it should slowly start around late 2025 (not the yellow line intercept) and continue throughout 2026.
Good luck with Alts. it's been pretty bad for some of the major ALTs.

BTC Dominance: Key Levels to WatchAfter the recent correction, BTC dominance is bouncing from the support zone at 59.64%. It looks like BTC dominance will likely retest the nearest resistance zone before any further downside.
If BTC.D breaks above this resistance, we could see more pressure on altcoins.
However, a rejection from this resistance zone could signal some relief for altcoins, giving them a chance to recover.
#PEACE
THANKS for the Read

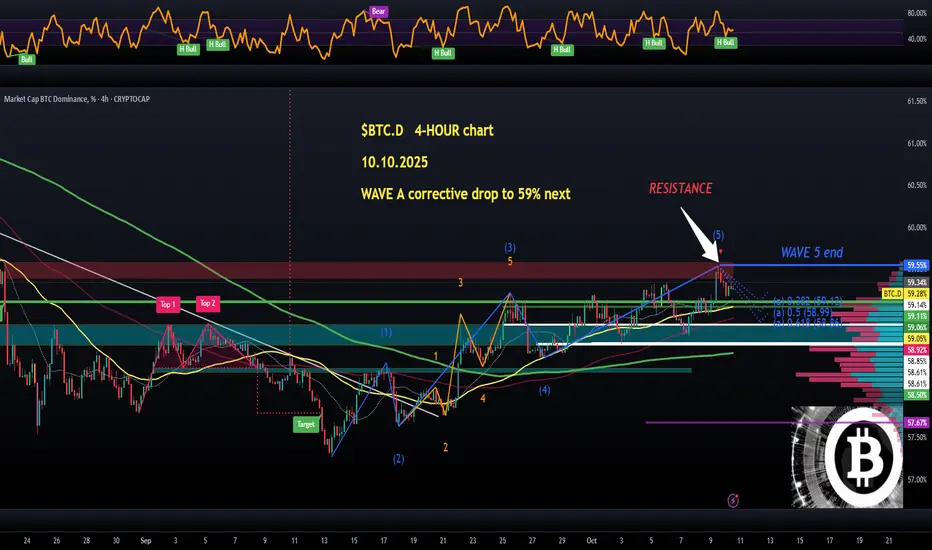
$BTC.D (4-hour): looking ripe for a deeper correction, WAVE A?CRYPTOCAP:BTC dominance on the 4-HOUR chart. Looks like the momentum is finally finished. WAVE 5 could be complete and that's exactly what the altcoins desperately need.
Dominance hit 59.55% whereas my projected top was at 59.57%. That's decent enough.
Resistance ZONE (highlighted in red) seems too much and we are ready to resume uptrends in many altcoins.
If I'm right, then we are currently seeing WAVE A correction down to roughly 58.99 or even below, then there should be a DEAD CAT bounce followed be a deeper corrective move.
We will see if this happens, fingers crossed. Time for the blood that some of us have been buying this week to turn into profits💙👽
BTC Dominance fallBTC.D has moved in a rising channel , once broken it can fall to 55.6% area so we may expect last pump for altcoins

Is Altseason About to Begin?The market structure suggests we’re currently in wave C of the second corrective wave (2) — and it looks close to completion.
A potential ending diagonal and bullish divergence on momentum indicators signal exhaustion among sellers.
At the same time, Bitcoin dominance is testing a key resistance zone — a level where liquidity often starts rotating into altcoins.
📈 If the current low holds, we could be witnessing the early stages of wave 3 — the impulsive phase where altcoins usually outperform Bitcoin.
🟢 Base scenario: Correction ending → beginning of a new bullish phase
🔴 Alternative scenario: Breakdown of the current low → completion of a W–X–Y structure

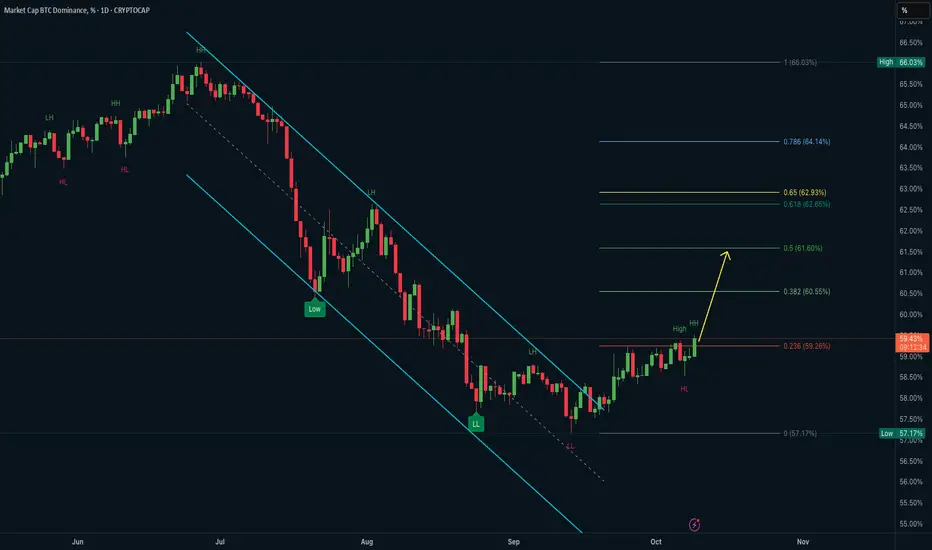
BTC Dominance Breaks Structure – Eyes on 60.5% to 62.9% Targets Downtrend Reversal:
➡️ The macro bearish channel from May–September has been invalidated with a clean breakout.
➡️ Structure shift confirmed: LL → HL → HH
➡️ Volume is increasing on breakout attempts, indicating growing strength in BTC over alts.
Fibonacci Target Zones:
➡️ Nearest target sits at the 0.382 retracement (60.55%)
➡️ Extension levels suggest confluence zones at:
• 61.60% (0.382 ext)
• 62.65%–62.93% (0.618–0.65 Fib cluster)
• 63.32% (0.236 from macro swing)
Support Levels:
➡️ Strong support below at 58.95%–58.58%, marking the previous breakout zone
➡️ HL confirmed above 57.17%, locking in the new bullish structure
📌 What This Means:
A rising BTC.D typically signals capital rotation back into BTC, reducing relative altcoin strength. If dominance reaches the 62%+ range, it may coincide with BTC breaking out while alts underperform.