$BINANCE:BTCUSDT BINANCE:BTCUSDT
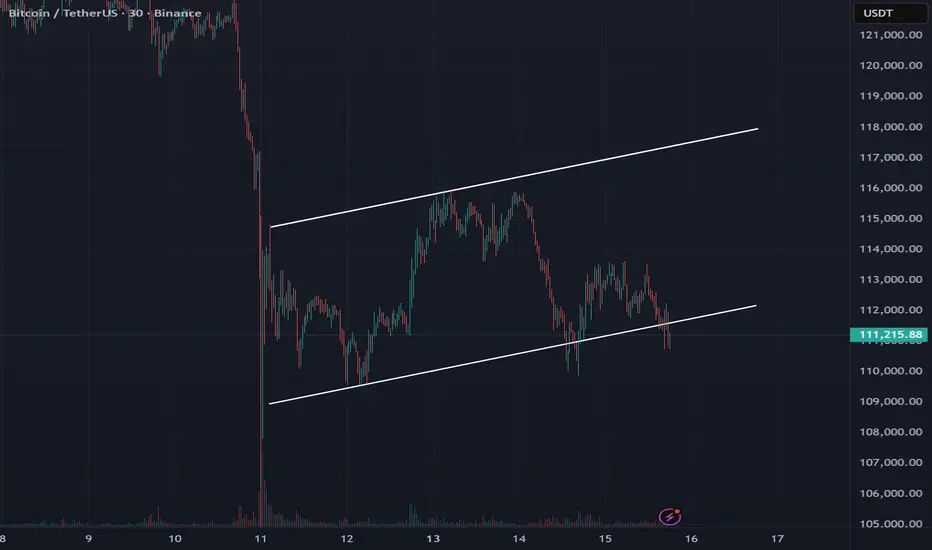
30min hollows
After a spectacular price drop of 16% - 17% over 8 hours on 30 minutes timeframe chart...
We can say that a downward parallel channel has been formed, from which since the price came out of the channel, this signaled the beginning of the consolidation phase, that is the stabilization of the price.
The stabilization rate ranges between 4%.
So using the Fibonacci retracement sequence, we can see the Support and Resistance areas forming.
So there is this condition:
If the price is within the support point and breaks it downwards, this means that the market trend will be downward.
Respectively, if the price enters the resistance point and then breaks it, we can say that we have an upward market trend.
and then the resistance point will become the support point.
Good Luck
#CryptoHellas team
Trade ideas

How to PCCE+FBD – Decoding Expansion/Exhaustion & Reversal zones🧭 PCCE + False Breakout Detector – Decoding Expansion, Exhaustion & Reversal Zones
How It Worked on the Chart
In this BTC/USDT 15-minute chart, the indicator detected several Price Coil Compression & Expansion (PCCE ) phases and confirmed false breakouts with visual clarity:
• Green vertical zones represent bullish expansion bursts — price coils tightly, then breaks upward with volume confirmation.
→ These often appear after sideways congestion, signaling early trend ignition.
• Red vertical zones mark b earish expansion bursts — price expands downward after compression, usually following distribution-like setups.
→ Notice how each burst frequently aligns with a decisive trend move.
• The “Burst↑ / Burst↓” labels highlight valid expansions confirmed by momentum and volume thrust conditions, showing continuation opportunities.
However, the true power lies in the False Breakout Detection System — the small “X”-shaped bullish (green) or bearish (red) crosses that appear at potential exhaustion points.
🔍 Interpreting the False Breakout Marks
The bullish “X” and bearish “X” crosses represent trap zones or deceptive breakouts that failed to sustain momentum beyond the coil’s boundary.
• Bearish X (Red) : Price attempted to break higher but was rejected, often marking a short-term top.
→ Can be used as a signal to exit long trades or prepare for short entries once confirmation candle closes below.
• Bullish X (Green) : Price dipped below the compression base but quickly re-entered, showing rejection of lower prices.
→ Indicates a failed breakdown, usable as an early long setup or exit from short positions.
🎯 How Traders Can Use It
1. For Entry Confirmation:
• Wait for a Burst↑ or Burst↓ label after a compression phase.
• Enter in the direction of the expansion, confirming with volume or candle momentum.
2. For Exit or Reversal Spotting:
• Use the False Breakout crosses as smart exit markers.
→ If you are long and a red “X” appears near the top, consider partial profit or tighten stops.
→ If short and a green “X” appears near the bottom, expect possible short covering.
3. For Reversal Trading:
• Combine “Burst” direction with the opposite false breakout mark.
Example: After a Burst↓ (bearish move), if a bullish X appears, it suggests exhaustion — a reversal or pullback may begin
💡 Practical Takeaway
The PCCE + False Breakout Detector effectively blends volatility compression theory with trap pattern logic, letting traders:
• Spot pre-move compression zones ,
• Identify false breakouts and momentum traps , and
• Time exits or reversals with visual precision.
This makes it a dual-purpose tool — both a trend-continuation detector and a reversal warning system — ideal for intraday and swing traders across all markets.

Bitcoin is going to the hell???hi follow me , boost this post and read
everything shows me that bull trend is over , weakness in highs , candles and the momentum
the targets for retracement is 83 to 74 and after that 50k
i know its hard to hear that but this is market he do what he wants so accept it.
thank you. i reply to questions anytime.

BITCOIN SIGNAL: THIS IS WHAT WILL HAPPEN NEXT!!!(smash it) Yello Paradisers! Enjoy the video!!
And Paradisers! Keep in mind to trade only with a proper professional trading strategy. Wait for confirmations. Play with tactics. This is the only way you can be long-term profitable.
Remember, don’t trade without confirmations. Wait for them before creating a trade. Be disciplined, patient, and emotionally controlled. Only trade the highest probability setups with the greatest risk to reward ratio. This will ensure that you become a long-term profitable professional trader.
Don't be a gambler. Don't try to get rich quick. Make sure that your trading is professionally based on proper strategies and trade tactics.

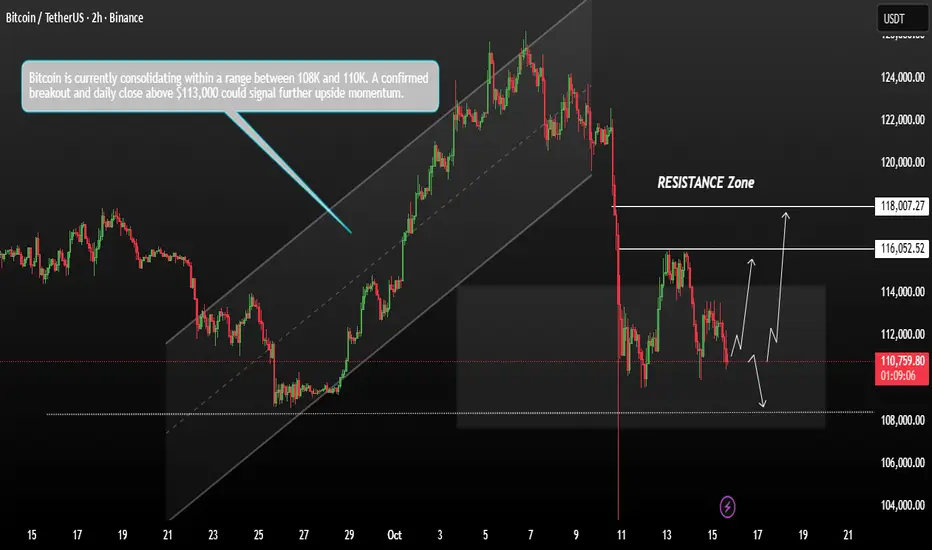
Bitcoin appears to be forming a bullish rangeBitcoin appears to be forming a bullish range, suggesting the market is entering a correction and consolidation phase. The current trading range is observed between 108K and 113K, indicating that price action is stabilizing before a potential breakout.
Technically, this range-bound movement reflects market indecision and accumulation, often preceding a larger directional move. If BTC manages to close above 110K, it would signal a shift in momentum and the possible start of a new bullish trend.
In such a scenario, the next upside targets could be seen around 116K–118K, aligning with key resistance levels and Bitcoin is currently consolidating within a range between 108K and 110K. A confirmed breakout and daily close above 113K could signal further upside momentum.
You may find more details in the chart.
Trade wisely best of luck buddies.
Ps; Support with like and comments for better analysis Thanks for Supporitng.
BTC/USDTCRYPTOCAP:BTC is showing a potential head and shoulders pattern with a target around $103K. For this bearish setup to be invalidated, price needs to reclaim and hold above $113K quickly. Until then, caution is warranted as confirmation will decide the next major move.

Ready for BTC/USDT's Next Big Move?🎉 BTC/USDT: "Bitcoin vs. Tether" Crypto Wealth Heist Map (Swing/Day Trade) 🤑
🚨 Thieves of the Crypto Market, Assemble! 🚨
Ready to pull off a stylish swing/day trade heist on BTC/USDT? This is your Crypto Wealth Strategy Map with a bullish setup that’s screaming opportunity!
📈 Let’s dive into this cheeky yet professional plan with a sprinkle of thief swagger to snatch those profits! 💰
📊 The Setup: Why This Trade is a Steal! 🕵️♂️
Bullish Confirmation: We’ve got a double bottom pattern signaling a potential reversal. ✅
Accumulation Zone: Price action shows buyers stacking up, ready to push BTC higher. 🛒
Heikin Ashi Reversal: Smooth, green Heikin Ashi candles confirm the bullish vibes. 🟢
Market Sentiment: The crypto streets are buzzing with optimism — time to capitalize! 😎
The Thief’s Entry Plan: Layered Limit Orders 💸
This is where our thief strategy shines! We’re using a layering strategy with multiple buy limit orders to sneak into the market like the slick bandits we are. 🕴️
Entry Levels:
🎯 $112,000
🎯 $113,000
🎯 $114,000
🎯 $115,000
🎯 $116,000
Pro Tip: Feel free to add more layers based on your risk appetite! Stack those orders like a master thief planning the perfect heist. 😏
Why Layering?: This approach lets you average into the position, reducing risk if the market pulls a fast one. 🃏
🛑 Stop Loss: Protect Your Loot! 🔒
Thief’s Stop Loss: Set at $110,000. This is our escape hatch if the market turns into a trap. 🕳️
Note: Dear Thief OGs (Ladies & Gentlemen), this SL is just a suggestion. You’re the boss of your own vault — adjust it to your risk tolerance! 💪
🎯 Target: Cash Out Like a Pro! 🏦
Profit Target: Aim for $127,000, where we expect strong resistance and potential overbought conditions. Watch out for a possible trap — don’t get greedy! 😈
Note: Dear Thief OGs, this TP is my take. You decide when to grab your profits and vanish into the crypto night. 🌙 Take the money and run at your own discretion!
🔗 Related Pairs to Watch 👀
Keep an eye on these correlated pairs (all in USD) to confirm the broader market trend:
BITSTAMP:ETHUSD : Ethereum often moves in tandem with Bitcoin. A bullish ETH could reinforce BTC’s upward momentum. 📈
BITSTAMP:XRPUSD : Ripple’s price action can signal broader crypto market strength. Watch for similar bullish patterns. 🌊
COINBASE:LTCUSD : Litecoin tends to follow BTC’s lead. A breakout in LTC could confirm our bullish bias. ⚡
Key Correlation Insight: These pairs often move together due to shared market sentiment in the crypto space. If BTC/USDT pumps, expect ETH, XRP, and LTC to potentially follow suit. Cross-check their charts for confluence! 🧠
🛠️ Technicals Recap: The Thief’s Toolkit 🧰
Double Bottom: A classic reversal pattern signaling bulls are ready to charge. 🐂
Accumulation Zone: Buyers are quietly stacking positions — a sign of strength. 📦
Heikin Ashi: Smooth candles filter out noise, confirming bullish momentum. 🕯️
Resistance Watch: $127,000 is a key level where sellers might step in. Stay sharp! ⚠️
⚠️ Disclaimer: Thief Style, Just for Fun! 😜
This Thief Strategy is for entertainment and educational purposes only. Trading is risky, and the crypto market can be a wild ride. Always do your own research (DYOR) and manage your risk like a seasoned bandit. I’m not a financial advisor, just a cheeky chart enthusiast sharing the vibe! 😎
✨ If you find value in my analysis, a 👍 and 🚀 boost is much appreciated — it helps me share more setups with the community!
#BTCUSDT #CryptoTrading #SwingTrading #DayTrading #ThiefStrategy #Bullish #TechnicalAnalysis #HeikinAshi #DoubleBottom #MakeMoney

New Monthly Distribution Schematic; 77.7K to 131K to 0As you can see, the Wyckoff schematic below shows a strong possibility that the 2021 bullrun was simply our Preliminary Supply area.
There is no way of knowing what the exact numbers are, but there is a strong possibility we top way before 150K, and a fair way above 123.6K, which is where the majority of shorts would be placed.
Currently we have a 5 wave structure. This is too easy. As the schematic shows, a Buying Climax liquidates Elliot Wave Bears.
130+ would create some euphoria, and lots buying the dip all the way down.

Bitcoin forms a clear bear flag patternBTC forms a clear bear flag pattern with a confirmed breakout below the lower boundary, signaling potential continuation of the downward move
BTC has clearly formed a bear flag, breaking through the lower boundary. According to the pattern, a downward movement will form
Current price: $110,872
The downward movement according to the pattern could continue to $109,880 and lower...
A rebound to the upper boundary of the pattern, around $114,550 , is also likely
More detailed analysis, additional charts, and key levels to watch are available on our site
Bitcoin Price Prediction: $351,000 Target Hi everyone! 😊
I've shared my Bitcoin analysis with you. Based on the RSI divergence with price, along with the formation of a cup and handle pattern, my final prediction for Bitcoin is reaching the target of 351,000 USDT. 🚀
However, I absolutely do not recommend long positions in futures trades due to the high risk from negative fundamental news. ⚠️
I hope you'll share your thoughts on this analysis! 💬
If you found this analysis interesting, give me some energy by liking it! 👍 Don't forget to share it with others! 🔄
Please note that trading responsibility lies with you, and my analysis is solely a personal opinion. 📝

BTC market snapshotInteresting squeeze — I wouldn’t rule out a new ATH. BUT a big **but** here: there’s an unplayed divergence on the higher timeframe and fading volume. The real question is whether they can push the price higher and still hold above $100K on the pullback. 🤔

Bitcoin Analysis for 2025 (best Entries)I’ve highlighted the best entry points for 2025 in my latest analysis for the upcoming month.

Bitcoin Daily AnalysisHi Traders
Bitcoin Daily Time Frame After Liquidity Hunt A multi-layered level is currently above its own Hunt line. The upper and lower liquidity points on the chart are characteristic and the condition for reaching the lower liquidity points is to close the daily candle below the Hunt line 109.260 in this case the support level below the liquidity is characteristic for Trigger Buy

7 out of 7, back-to-back accuracy. Power!Since last week Monday I thought to share my AI forecasts with the public using Bitcoin 30min chart as my chart of choice.
It's taken 8 years of growth to be able to get here, and it feels like I have finally made it
I say this as yesterday my nerves were letting doubt in, thinking that this next forecast would be the one that didn't work out... instead it's brought 7 out of 7, back-to-back accuracy. Power!

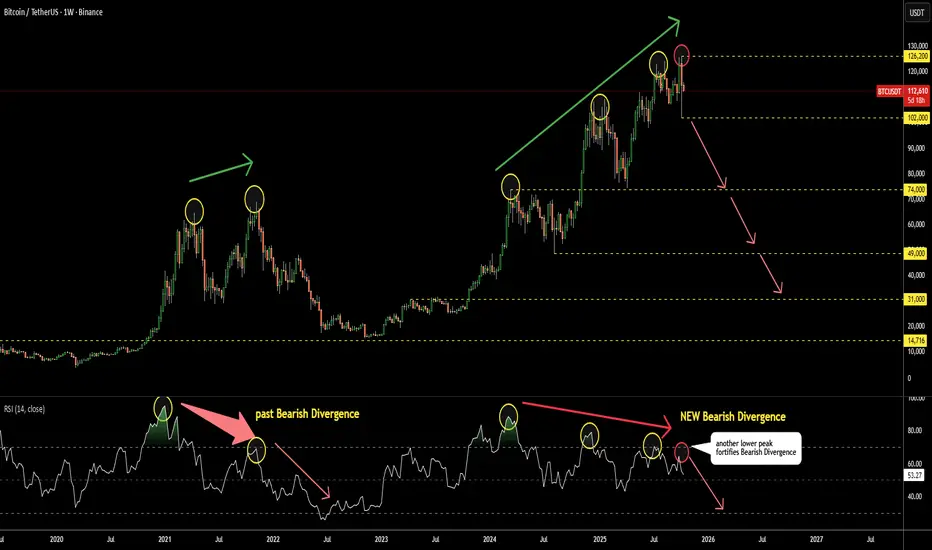
Bitcoin Update: Bearish Divergence on RSI Only Deepens This is a brief update to the analysis shared in August. The RSI has now formed a fourth consecutive lower peak on the weekly chart, further confirming the bearish divergence.
Monitor the RSI closely — a break below 50 (currently at 53) could signal the onset of a bear market.
The first key support level is near 102K, and a decisive move below this level would strengthen the bearish outlook.
BTC to 70kThis is my idea on $BINANCE:BTCUSDT. We all know BINANCE:BTCUSDT hit all time high reached 70k in 2021. In 2024 we all witnessed BITSTAMP:BTCUSD able to break all time high reached new high which is 126k. Was there any consolidation after breaking high 70k? yes there was but BITSTAMP:BTCUSD never able to check 70k from above, you can say there is a gap BITSTAMP:BTCUSD must come to fill. There are few minor support zones which may able to hold BITSTAMP:BTCUSD but I wouldn't trust those areas which is around 100k, 86.5k, 75k. If BINANCE:BTCUSDT ever reach 75k-70k that means BTC is ready to make higher high. In worst case scenario we might see 65k 60k 50k, which may caused by Trump speaking or any other major news related to USD.

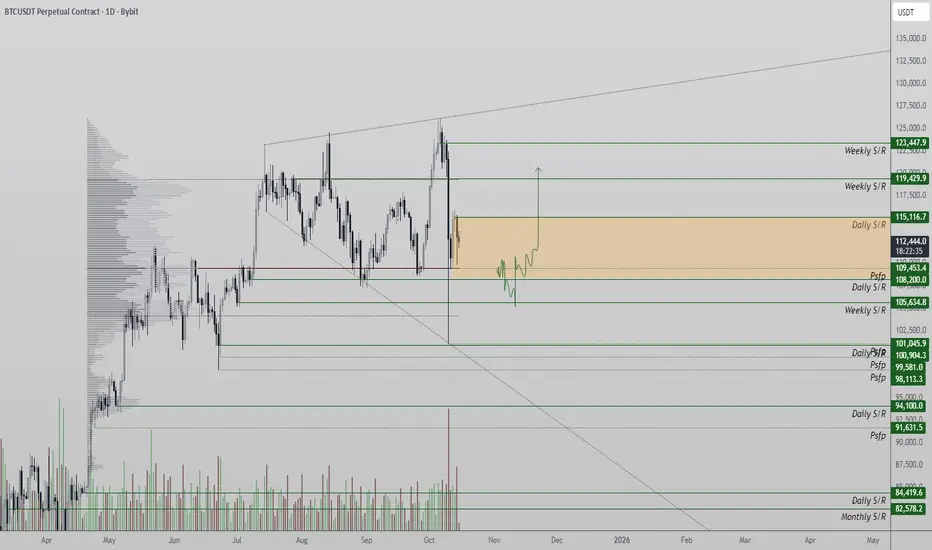
BTC Range Consolidation Above POC Signals Reaccumulation Bitcoin has shown interesting developments following a capitulation move into lower liquidity regions. The recent low tapped the $101,000 dynamic support, forming a potential base in confluence with major structure and liquidity.
Key Technical Points:
- Support: $101,000 dynamic support
- Range POC: $108,000
- Bias: Bullish-to-neutral above POC
Price has reclaimed the range point of control, suggesting that short-term control lies with the bulls. A consolidation period above this level could lead to a shallow pullback into daily support near $108,000, followed by a rotation back toward range highs.
If structure remains intact, the next impulsive leg higher could emerge from this region. However, a daily close back below the POC would weaken the setup and open the door for renewed volatility.
Overall, Bitcoin remains constructively positioned for reaccumulation while above $108,000, with consolidation favoring a potential bullish continuation.
Buy Bitcoin 106500Bullish, tp 130k.
Bitcoin is testing a key resistance near 108,000. A breakout above this level could trigger a strong bullish continuation. Watching for a clean close above resistance to confirm the move toward higher targets.
Good luck!

The Aurox Indicator going long (for now)Those who used to use Aurox may recognize this indicator.
Here we have it putting down signals before each of the three liquidity events lately!
On the 2h, it is long - we will see how long this lasts.

Don't you believe our team's analysis?Comrades, don't you believe in our team's analysis?😂
As we said 3 months ago about the first target, after the collision we expect a correction and after the correction we will move to the second target to the specified area.
Now this event is being completed bit by bit, what should you do now, after the heavy fall we had, Bitcoin made a candle with a long shadow, and this type of candle with a long shadow, the price moves again under the shadow with small candles and continues its trend again.
After the current fall, you can think about a step of buying.

Next AI Forecast is outIt appears we are going to have some ranged action coming in
It's about correct timing when this happens.
Make sure to open and close your trades on confirmed turning points

BTCUSD SHOT VIEW ON 30 MINUTES /3 HHas my previous analysis i have told you that bitcoin will go below 2 lakh i am still stock to that analysis Start buying around 96 lakh dollar I any one is willing to invest

BTCUSD Bystra SnR+QMR levelLooking for buy at this SnR level + QMR which is high risk high reward area.
Stoploss is but tight so I can take that risk.
