Bitcoin Daily ChartMoon soon?
Bitcoin is about to break the falling trendline then moon to 80k levels.
Going back again under the green rectangle cancels this analysis.
BTCUSDT.P trade ideas


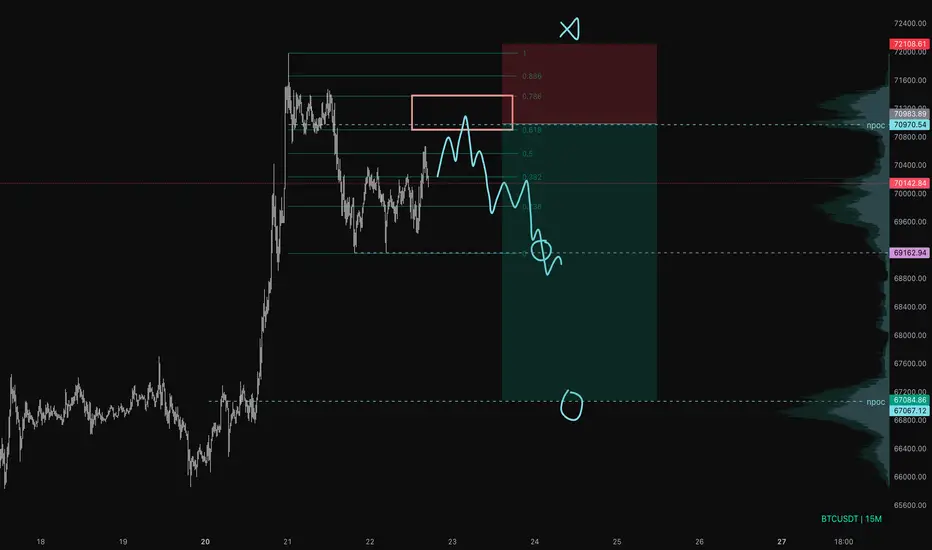
BTC climbing up again?Since we couldnt reach my bottom side target (fat white line & 4hr 200ema) there is imo no market structure shift that would justify further htf shorts here. Also with us reaching the minimum target for our blue mini sequence i see its time for a correction. Looking at that green box here for longs into the second blue/ first green target. Lets see if we can take out the topside fat white line to justify new highs

BTC-USDT | 4H LONG | TECHNICAL CHARTHello traders, Two types of formation TOBO, FLAG I will give the Tobo target after the resistance point is broken. Flag target; 70100.00
My dear friends, do not forget to manage 2% risk. If you want me to constantly update my bitcoin analysis, please do not forget to press the like button and turn on notifications and follow me, my beautiful family.
I love you, may God protect you.
Prof. TraderTilki

Bitcoin LiquidationBitcoin Liquidation
there is Short & Long Liquidation price on binance
I look about the liquidity prices there is a huge liquidity
Long Liquidation red line's
65750
64450
Short Liquidation long line's
73600
72550

Whether a full-fledged upward trend has begun: 69K-70231.38Hello traders!
If you "Follow" us, you can always get new information quickly.
Please also click “Boost”.
Have a good day.
-------------------------------------
(USDT 1D chart)
(USDC 1D chart)
If USDT and USDC show a rising gap, I think it is evidence that funds are flowing into the coin market.
(BTC.D 1M chart)
In order for the coin market to continue its upward trend, it must meet resistance and fall in the 55.01-62.47 range.
If this is not the case and BTC dominance continues to rise, it is highly likely that funds in the coin market will be concentrated towards BTC, making it quite difficult to trade altcoins.
(USDT.D 1M chart)
In order for the coin market to continue its upward trend, it must remain below 4.97 or show a downward trend.
Summarizing the explanations of BTC dominance and USDT dominance, in order for a bull market in the coin market, that is, a bull market in which most coins (tokens) rise, to begin, BTC dominance and USDT dominance must show a downward trend.
--------------------------------------------------
(BTCUSDT 1D chart)
This volatility period lasts until May 20th.
If the price rises above 69K-70231.38 and maintains the price, a full-fledged upward trend is expected to begin.
The key to this full-fledged uptrend is whether it can break above the upper point of the HA-High indicator box on the 1D chart.
If not, and it goes down,
Support should be checked around 65233.64 (64K-66401.82).
Currently, the MS-Signal indicator (M-Signal on 1D chart) is passing around 65233.64, so it is important to see whether the price can be maintained above this point.
(1M charts)
If the price holds above the Fibonacci ratio point of 1.27 (73308.95), the next target would be around 1.618 (88913.24).
If it declines in the first section, you need to check for support in the second section.
The HA 5EMA line is rising near 0.886 (56090.42), so if it falls below 0.886, there is a possibility that a downtrend will begin.
Therefore, caution is required as sharp drops may occur.
The next period of volatility is around June 4th.
-------------------------------------------------
(BTCUSDT 1D chart)
The indicators used to find a position to start a trade are the HA-Low and HA-High indicators.
And, the indicator used to verify this is the BW indicator.
Have a good time.
thank you
--------------------------------------------------
- The big picture
A full-fledged upward trend is expected to begin when the price rises above 29K.
This is the section expected to be touched in the next bull market, 81K-95K.
#BTCUSD 12M
1st: 44234.54
2nd: 61383.23
3rd: 89126.41
101875.70-106275.10 (when overshooting)
4th: 13401.28
151166.97-157451.83 (when overshooting)
5th: 178910.15
These are points that are likely to encounter resistance in the future.
We need to see if we can break through these points upward.
Since it is thought that a new trend can be created in the overshooting zone, you should check the movement when this zone is touched.
#BTCUSD 1M
If the general upward trend continues until 2025, it is expected to rise to around 57014.33 and then create a pull back pattern.
1st: 43833.05
2nd: 32992.55
-----------------

BTC Long Target 74KFormations of the triangle are starting to reveal it's with the next long target being 74K

🎉🎊CONGRATULATIONS IF YOU LONGED THAT! | WEEKEND BREAKDOWNIn todays video we go over the recent price action on bitcoin, we longed a nice reaction off daily supply for a continuation play to the range high, lets see how far this rallies up.
Follow for more

BITCOIN - Price can bounce down to $65700, exiting from flatHi guys, this is my overview for BTCUSDT, feel free to check it and write your feedback in comments👊
Recently price broke $62800 level, which coincided with support area, but later started to grow in rising channel.
In this channel, BTC in a short time rose to $62800 level, but at once made correction move to support line.
Soon, price turned around and made upward impulse, breaking $62800 level, and continued to grow in another rising channel.
Later Bitcoin reached $69200 level, which coincided with one more support area, and soon broke this level.
Price exited from rising channel and started to trades in flat, where at the moment it continues to trades.
So, I think Bitcoin can make small move up and then bounce down to $65700, exiting from flat and breaking support level.
If this post is useful to you, you can support me with like/boost and advice in comments❤️

BITCOIN to BREAK OUT TO 84k !!!! SPX - BTC Comparison StudyI noticed a similarity in market structure between BTC and SPX. As you can see the fractals are very similar! lets see how it plays out.

Bitcoin up to 80,000 USD on Daily chart... between 3 and 10 daysBitcoin up to 80,000 USD on Daily chart... between 3 and 10 days, clear pattern

Bitcoin and altcoins overview(May 24-25)Yesterday, we dropped below our support level for Bitcoin, and now this zone has become a resistance zone. The local scenario has shifted slightly in favor of shorts, but globally we prioritize reaching a new ATH (All-Time High).
During the drop, there was an attempt at significant volume defense, which was unsuccessful. We are now consolidated below this level, making it an additional local resistance zone.
Sell zones: $69,200-$70,000 (accumulated volumes), $71,000-$71,400 (volume anomalies).
Buy zones: $64,500-$62,700 (pushing volumes), $61,200-$60,400 (volume zone), $58,500-$57,000 (volume anomalies).
Interesting altcoins:
RUNE , if it breaks out upwards from the marked volume zone, consider a long position upon its return to this zone.

BTC BREAK OUT DONE! READY FOR $100K!!Hey everyone! If you find this content valuable, please consider giving it a thumbs up and following for more analysis.
Welcome to this BTC update!
BTC looks good here. BTC recently broke out of a bull flag pattern on the daily timeframe and has held above it so far. This could be a sign of continued bullish momentum. After this successful retest, expecting another leg up.
Target:- $130k
Invalidation: A daily close below SWB:69K will invalidate this bull flag.
What do you think about this setup? Share your views in the comment section.

Hunting BTC Long Up to 72788.20hunting a long on btc. second 2w dol hasn't been reached yet at 72788.20 . H8 still delivering bullish, we are sweeping a fractal h8 low now. will long on m30 bullish cisd.

2024-05-24 BTC market call, waiting for the Final hype phase - I believe BTC is currently in the fourth corrective wave of the full Elliott Wave cycle (highlighted in light blue).
- After a short-term correction (yellow line), it will enter the final hype phase.
- The buying opportunity is around the 65-66k level.
- Watch the trend line would supports the price, but keep in mind that this process will take time.

BTC USDT - Long Set upNot shorting but if market gives a pull back at the mentioned support which has confluence with MA 50 1D day time frame. I will long it.

TP MAYBE BETWEEN 69809 TO 70550$I think that Bitcoin has reached the price target of 66,291, and in other words, it has reached the end of the four-hour bearish wave, and in view of this, a head and shoulders is forming in fifteen minutes, which is a target equal to It will have 69809 to 70550.

BTCUSDT :Bitcoin is in our big box, you can't pay much attention to the candle unless we go to open a short position in four hours, open a long position at 69369, open a short position below 66029
My whale refused to sacrifice our head
Either we will move above 71484 or we will move below 60666
The forecaster who predicts, I analyze warm analysis, I don't have the science of technical analysis
71484 and 60666 of this box for Bitcoin daily time frame
Prediction of work ahead of time 😂

💸#BTCUSDT | 1 HOUR TIMEFRAME UPDATE💸#BTCUSDT | 1 HOUR TIMEFRAME UPDATE
The objective for this UPWARD movement is to achieve $70,200 - $70,800 - $71,500 - $72,800 - $74,000🔼
Invalidation below $68,700 ❌

BTC: just execute habibiwhile bulls and bears keep fighting, we just do what we always do:
1. Identify levels:
volume
time
math
2. Look for high probability setups with good r/r
3. Execute
Remove the noise, just trade the chart
📉Think Outside the Box BTC!📈BINANCE:BTCUSDT
COINBASE:BTCUSD
Hello Dear Traders.
🔴The market has reached the end of its suffering range and our team's holiday break is nearing its end.
⚡️ In this post I will track the BTCUSDT movements as long as it stays inside the Box.
🔴The past few weeks, the pressure of market volatility was very high and we needed a break.
We will review the market again from today.
Please share the analysis posts to support and give us energy.

BTC going 73K at 22 16:00H - FB Prophet Model PredictionThis is model using FB Prophet Model in Python.
1. First we look at the price for last 2 months and it volume, trend shows similar amount of trades, time and potentially same buyer and seller.
2. PB prophet then start to create prediction around this movement and anticipate the next volume for next week.

BTC USDTBTC USDT Break of a descending triangle. will take entry on 0.382 of fib retracement. with stop loss above the previous lower high.
