The god of fractal draw thisORVIBE STRATEGY
A new model thinking
New analyses and …
ORVIBE.
BE THE LIGHT!
Trade ideas

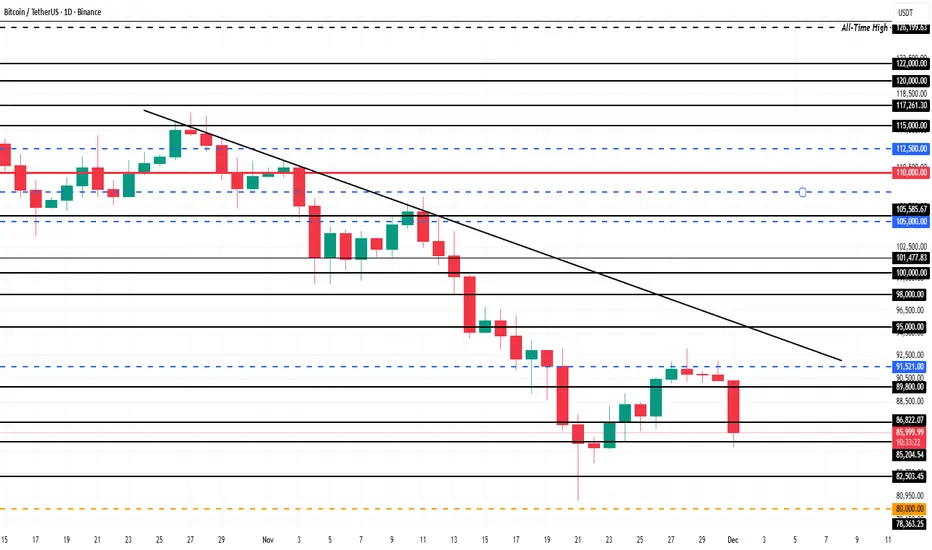
Bitcoin trade analysis1. Trend & Structure
Price is inside a rising channel (light-blue lines).
BTC is sitting directly on the lower channel support, meaning this is a key decision zone.
Small candles and narrowing price range indicate compression before a breakout.
2. Support & Resistance
Level Type
90,300–90,500 Local support (EMA cluster + channel bottom)
91,200 Minor resistance
93,000–93,400 Major resistance (top of channel + horizontal level)
95,000 Higher-timeframe resistance
BTC is trading directly above major support, which makes a long more favourable unless support breaks.
3. Candlestick Interpretation (single clear conclusion)
Current candles show small-bodied consolidation with long lower wicks → buyers are defending support, signalling a bullish continuation attempt.
→ Precise conclusion: Bulls are holding support, making a bounce more likely than a breakdown.
4. Indicator & Oscillator Signals
EMA Ribbon (12–200): Price is sitting on the fast EMAs but still below high-TF EMAs → slightly bullish short-term but still inside a broader bearish pressure zone.
Volume: Decreasing → momentum is coiling → breakout imminent.
5. Elliott/Wave Structure
Price appears in a corrective wave (wave 4) inside an ascending channel.
If support holds, a push toward wave 5 to the channel top (92.5–93.4k) is likely.
6. Volume Analysis
Buyers appear on each dip.
Selling volume is weak.
No capitulation spike → accumulation-type structure.
🎯 Conclusion
BTC is at the best possible long-entry zone inside the rising channel.
A long is preferred as long as 90,300 support holds.
A short becomes valid only if price closes below the ascending channel.

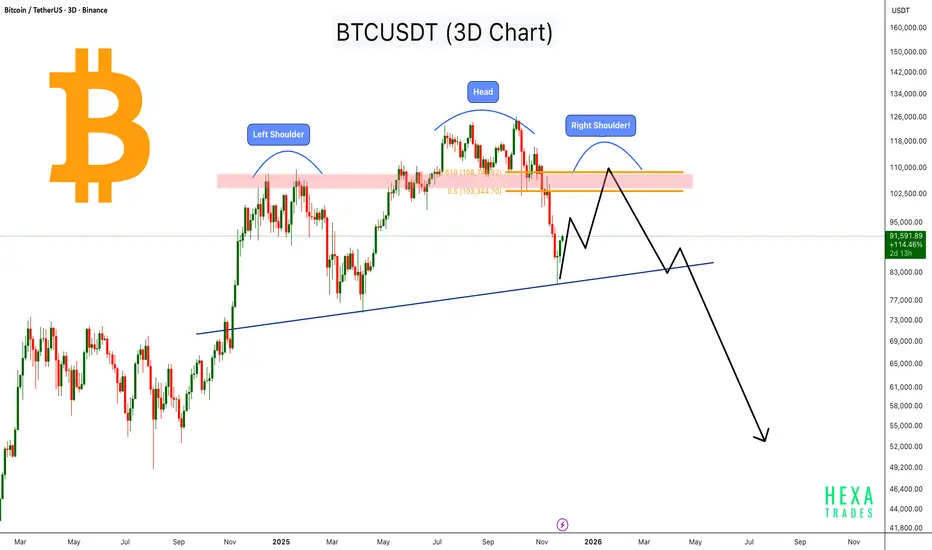
BTC Forming a Massive Head & Shoulders - Macro Reversal Ahead?Bitcoin is forming a large Head & Shoulders pattern on the 3-day chart, with the left shoulder and head already completed, and the right shoulder now developing within the major resistance zone around the 0.5–0.618 retracement (103,000–108,000).
Price recently bounced from the long-term ascending trendline, but the overall structure still suggests a potential macro reversal unless Bitcoin breaks above the resistance zone with strong momentum.
If the right shoulder completes and price rejects from the supply zone, BTC could retest the trendline again. A breakdown of this trendline may open the door for a deeper correction toward the lower demand zones.
This is a medium-term pattern and may take 1–3 months to validate fully.
Key Points:
- Left Shoulder, Head, and Right Shoulder zone highlighted
- Major resistance at $103,000–$108,000
- Price bouncing from long-term ascending trendline
- Breakdown below the trendline may trigger a strong downside move
- Right shoulder formation may take a few more weeks
Cheers
Hexa
BTCUSDT.PA safe and sound plan has been marked on the chart on 1 day TF.
It might take long time but as soon it will drop to our zone and we see some bullish momentum we are in definitely.
Trading is only patience we cannot just move with moving line.
We need the price to act as we need and once the price starts acting as we decided than it will go where we want to see.
Have a good trading.
Trade once or twice a month is better than trading whole day 24/7.
Make it a peace of mind not stress.
Follow for more.

Bitcoin Analysis – November 29|Calm Before the Storm !Let’s jump into today’s market outlook! 🔍📉📈
The Fear & Greed Index is sitting at 20, which means market participants are still in fear mode 😨.
Today’s structure hasn’t changed much compared to yesterday — except for one key detail: we had a fake breakout on the top of our box, and that increases the probability of a downside break.
Your long and short triggers are still the same as yesterday’s plan.
Just remember: tomorrow is the last day of the month, and monthly closes can get wild — so risk management is everything 🛡️.
✔️ Keep your stop-losses tight
✔️ Track Bitcoin’s price action together with its dominance
✔️ Don’t force trades — let the setup come to you
Trade safe, stay sharp, and manage your capital like a pro! 🚀

BTCUSDT.P - November 30, 2025The chart shows Bitcoin in a short‑term downtrend on the 15‑minute timeframe, with price consolidating in a tight range after a strong impulsive selloff, indicating corrective structure rather than a confirmed reversal yet. Resistance is clearly defined around 92,600–92,800 where prior selling pressure emerged, while immediate intraday support is clustered near 90,500–90,600, with a deeper support zone just below 90,000 acting as the invalidation area for the projected long setup. A break and 15‑minute close above the mid‑range resistance band around 91,200–91,300 would confirm bullish momentum and open the path for a trend‑continuation push toward the marked profit zone, whereas a failure there followed by a move back under 90,600 would favor another leg lower into the support block before any meaningful bounce.

BTC: Waiting for 120KBTC is currently below 90K, which is a great buying opportunity. Hold patiently and wait for it to reach 120K.
I'll send out accurate signals right at the opening every day, don't miss out.

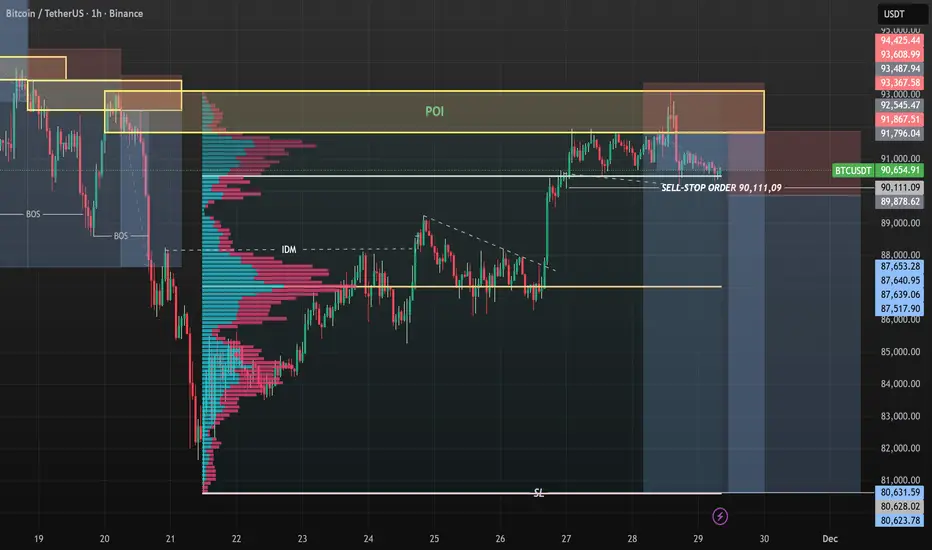
SELL-STOP ORDER ON BTCUSD......BTCUSD completed +1,900pips from my yesterdays analysis predictions today we have the price making strong rejections at the VAH on the Volume profile chart am looking forward to see price make a breakout the downside to take out the liquidity to sell down to new lows
Lets take or see your thoughts on this.....
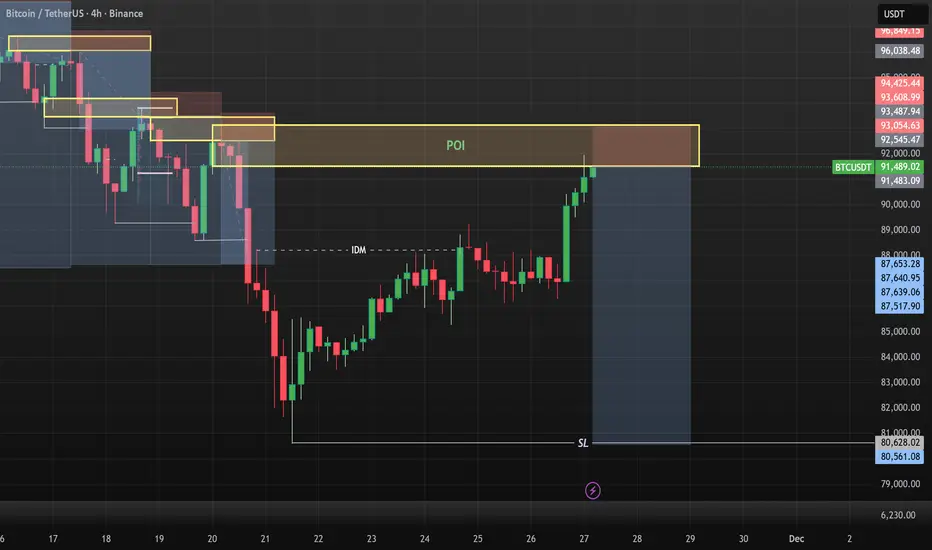
BTCUSDT - What's Next? Bullish is over???BTC Daily & 4H Outlook
Bitcoin is showing mixed signals across the 1D and 4H timeframes. On the daily chart, BTC failed to hold the strong support zone and has now officially flipped it into a resistance. The drop also swept liquidity down to the 80.600 area before rebounding from the daily OB, which gives us a temporary relief bounce. Right now, price is pushing upward and may retest the resistance/supply zone above.
If BTC rejects strongly from that resistance, the market could be in trouble again because the downside target reopens toward the 83k–86k region. This area becomes even more important when we look at the 4H chart, where we still have a key support between 85.650–85.000. This zone must hold—if it breaks, then 83k becomes likely, and a worst-case scenario returns us to the 80k sweep zone.
For BTC to reclaim momentum and shift into a bullish structure, the market needs to break out above the major supply at 93.240. A clean breakout and confirmation would show strength and could trigger the next leg toward 98k–100k. If that happens, we may also see a strong positive impact on altcoins.

BTCUSD SELL NOW!!!BTCUSD completed +1,800pips from my yesterdays analysis predictions today made made a sharp pull back into my 75% sell zone in my fib level in the premium zone am on a sell from this zone holding till price arrives 80k.....
BTC/USDT 4H Chart Review🧭 1. Main Market Structure
The chart shows:
A broad downward channel that has been in place since the end of October.
The price bounced off the upper line of the channel, made a local upward impulse (orange trend line), and then broke it, returning back towards the lower regions of the channel.
➡️ This means that the dominant trend is still downward, and upward bounces are corrections.
🧨 2. Current Chart Situation
BTC has broken through:
the local uptrend (orange line)
fell below the 88,500–89,000 zone (green)
is heading towards further support levels
Currently, the price looks like a typical retest of the broken structure and a continuation of the decline.
🟩 3. Key Price Levels (S/R)
Resistance (upper – green):
91,600 – 92,000 – key level, a breakout would negate the local downtrend
95,000 – 97,500 – upper range of the descending channel
Support (lower – red):
85,300 – 85,800 – local support (price is currently reacting here)
83,000 – 83,100 – strong horizontal support
79,800 – strong support, historically strong in this timeframe
76,600
75,000 – lower band of a potential drop + near the lower boundary of the channel
➡️ The most logical downside targets are 83,000 and 79,800.
📉 4. Descending Channel (black) (lines)
The price has rebounded from the upper range of the channel and is heading towards the lower range.
The middle line of the channel has been broken down → a signal of trend continuation.
The lower boundary of the channel indicates a potential low around 75,000–78,000.
🔄 5. Stoch RSI
Currently oversold in the oversold zone, it is starting to curve upwards.
In a downtrend, long signals are weaker, but a short-term rebound is possible.
🧭 6. Scenarios
📉 Bearish scenario (more likely)
Technical rebound to 88,500 – 89,000
Rejection from this zone → continued decline
Targets:
83,000
79,800
Extremes: 76,000 – 75,000
➡️ This scenario is consistent with the trend and a rebound from the upper channel.

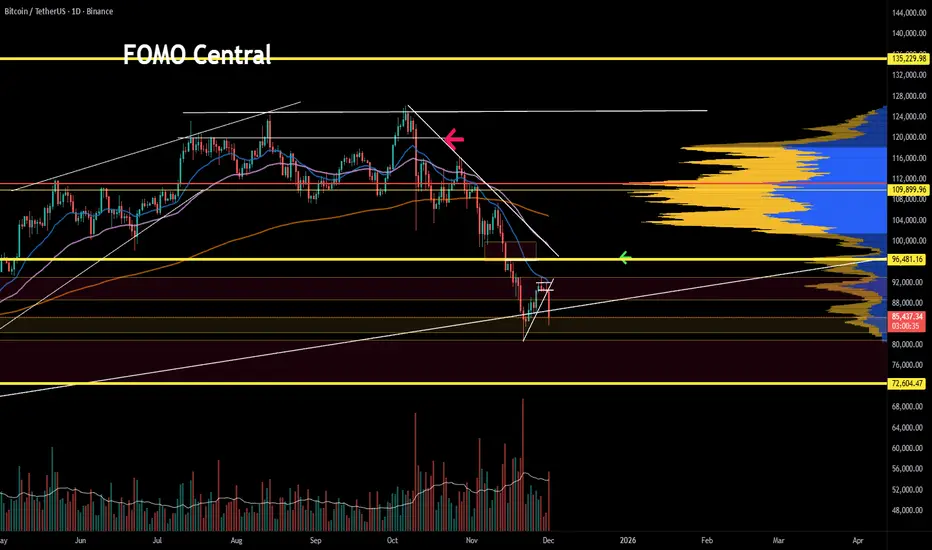
Bitcoin still in reactive phaseBitcoin’s relief bounce stalled right at the descending trendline, and the move up couldn’t break through the mid-96k supply zone. Momentum is cooling off again, and volume isn’t supporting a breakout.
Unless price can reclaim that trendline with conviction, the chart still leans corrective. Key areas to watch on the downside remain the mid-80k zone, with stronger support lower in the 70s where demand and volume profile stack up.
For now, BTC is still in a reactive phase. Bulls need a clean close above resistance to shift the structure. Until that happens, caution makes sense.
BTC on MonthlyDear Traders
i see btc may visit for now 67k then go back up max target 150k
lets see if this can play

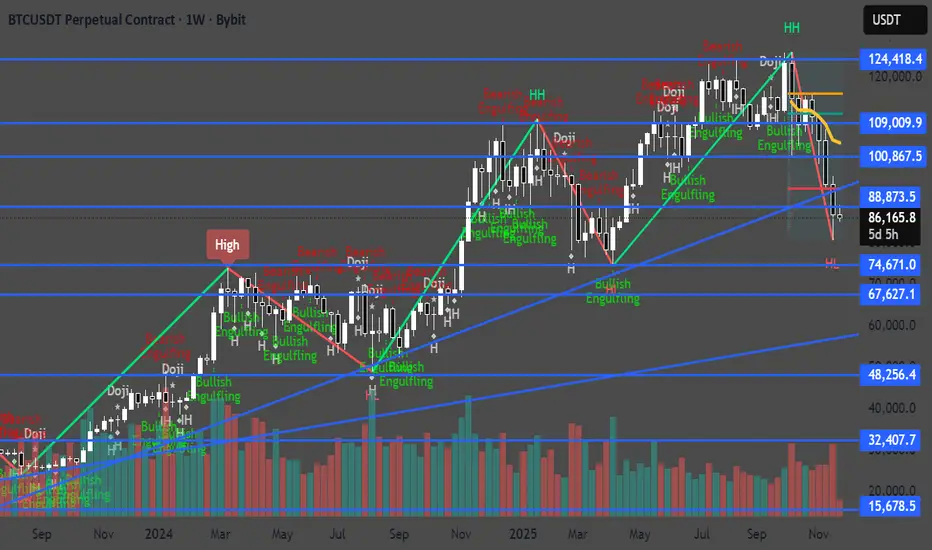
BTC Major trend Bitcoin on the weekly timeframe is currently resting on four zones starting from March 2020 until now in late November 2025, and this is a strong indication of the strength and stability of the upward trend.
The 125K area is considered important to break with strong trading volume.
For more deep analysis flow me on Clubhouse
This is not financial advice.

Bitcoin Price Falls To $86,000; Will It Shake Out Weak Hands?Bitcoin is trading at $86,005, holding just above the $85,204 support level. The asset remains trapped under a persistent downtrend that has lasted more than a month. This would preventing any sustained recovery attempts.
If market conditions worsen or short-term holder selling accelerates, Bitcoin could break below $85,204. A drop through this support would expose the price to $82,503 and potentially deepen losses as fear rises across the market.
However, if buyers step in and support strengthens, Bitcoin could reclaim upward momentum. A bounce from current levels could send BTC toward $89,800. A decisive move above that resistance would be essential for Bitcoin to retest $90,000 and invalidate the bearish thesis.
$BTC | $ALTS Scalp Setup Coming?I’m waiting for CRYPTOCAP:BTC reversal on STF if it bounces from current zone, I’ll take scalp entries in alts if it doesn’t reverse, I’ll stay flat.

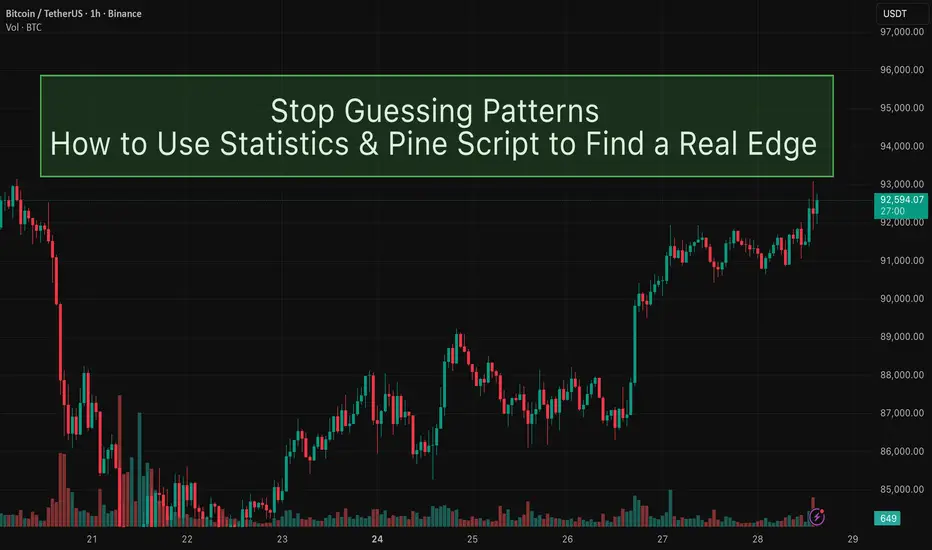
How to use statistics and Pine Script to find a real edge.Are patterns really profitable, or are we just connecting random candles with a story?
Most of us started trading by seeing patterns on the chart: double bottoms, pin bars, three green candles, “smart money” footprints… but do we have any evidence they actually works ?
In this idea, I want to talk about the statistical significance of chart patterns, and how you can use simple statistics + Pine Script to move from “I think this works” to “I measured this edge.”
◼ Patterns are opinions until you define them
“Strong bullish candle”, “nice rejection”, “liquidity grab” – these are subjective words.
Statistics don’t work with feelings, they work with clear rules. Before testing anything, a pattern must be converted into something like:
Candle 1: bullish, body size > X% of price
Candle 2: low does not break previous low
Close of Candle 3 > high of Candle 1
Once you can write your pattern as strict conditions (true/false), you can: Count how many times it appeared, measure what happens after it appears, and decide if it’s worth trading or not. That’s where Pine Script becomes a powerful research tool.
◼ What does “statistical edge” actually mean?
A pattern is interesting if, when you look at many occurrences, you see a consistent tendency. For example, choose a simple question like: “When this pattern appears, where is the price on average after 10 bars?”
If you track that over hundreds or thousands of samples, you’ll get:
How often price is higher vs lower (win rate).
The average move (for example, +0.8% after 10 bars).
How volatile or noisy the results are.
This doesn’t magically make a holy grail, but it tells you: Is this pattern better than random? Is it worth building a full strategy around it? Without this step, you’re basically trading based on screenshots and memories.
◼ Using Pine Script as your statistics magic tool.
Even without going deep into code, the logic in Pine Script is simple, here is a simple example that you can do.
A. Detect the pattern Whenever your conditions are true on a bar, mark that bar as a “pattern bar”.
B. Look forward in time For each pattern bar, check the price after N bars (for example 5, 10, or 20 bars later). Calculate the % change between the pattern close and the future close.
C. Aggregate the results Keep a running count: How many patterns triggered (sample size), How many ended positive (wins), The average % move after N bars.
D. Interpret the numbers If you find that your pattern appeared 800 times, and after 10 bars: 62% of the time price was higher, Average move was +0.6%... then you have something much more concrete than “this looks good on the chart.” You don’t need to turn this into a full strategy immediately. Even a simple statistical study like this already filters out a lot of illusions.
◼ Common mistakes when testing patterns
When you start doing this, it’s easy to fool yourself. A few traps to avoid:
Tiny sample size : If your pattern only occurred 15 times and 11 of them were winners, that 73% win rate is probably not reliable. Statistics start to mean something with large samples (hundreds or thousands of events).
Obsession with win rate : A 70% win rate means nothing if your winners are tiny and your losers are huge. You must look at: Average move, Distribution of outcomes (are there huge negative outliers?), How a realistic stop-loss / take-profit would behave. Sometimes a pattern with 52–55% win rate can be excellent if the average reward is larger than the average risk.
Overfitting the past : If you keep changing rules until the backtest looks perfect, you are no longer discovering a pattern – you’re forcing the past to agree with you. A healthier flow is: Start with a simple, logical idea. Define it clearly in rules. Test it on one market / timeframe. Check it on other symbols and timeframes without changing the rules.
If the edge survives in different environments, that’s much more interesting.
Using this approach will save you a lot of time and money in losses, do your research before taking a trade, make sure you have the statistical evidence if you want to trade a pattern.
i will be sharing more ideas on the use of Pinescript to improve your trading in the next days. make sure you follow me.
BTC: Continue Going LongAfter testing the resistance level of 92K, BTC declined again to build up momentum, waiting for the next upward movement. As I have mentioned multiple times, levels below 90K are suitable buying opportunities, and today we continue to go long on BTC.
BTC Trading Strategy for Today:
BTCUSDT buy@86000-87000
TP:90000-92000
All signals for consecutive long positions have been profitable. I will continue to send accurate signals at the opening of the market every day—don’t miss out.

Still no reversal sign on weekly timeframeI expect a sweep of 74k before we see a reversal sign from btc.
BTC longIn the long zone, I am taking a BTC long. The long zone is the weekly support zone. The long position is valid for me as long as we don't fall and close a weekly candle below the weekly zone.
Entry: $83,175
TP: $91,200
SL: $79,760
RRR: 2.34"

BTCUSDT sell ✅ 15m overextended to upside OR losing momentum after trend.
✅ 5m divergence in price (highs not holding), rejection candles, slowdown.
✅ 1m structure shift — higher lows break down into lower highs, confirming reversal trigger.
✅ Entry made on 1m lower high after rejection confirmation.

BTCUSD SELL CONTINUATION TO 80K.....Still very bearish on btc am only changing bias to once price breaks 93,500 for below this zone is a sell entry for me but if price breaks above 93,500 am positioning for buys to 100k for another sell off for still sell....

BTC Buy The PullbackLooking for the next Bitcoin opportunity? Buy on the pullback and position yourself for the next upward move. Stay ahead of the trend with our timely signals and make the most of market corrections.
