btc. timeframe W & Mwe waiting for reach the price to 100k.
To start moving into this area, we first need to see the break of 71k and its consolidation
BTCUST trade ideas

BTC trendline has a problem?Trendline traders might face challenges soon. #BTC
For me, the key level is 64.3k. We can test this level, and it should hold.
Until then, there's no need to worry. Hold your positions.

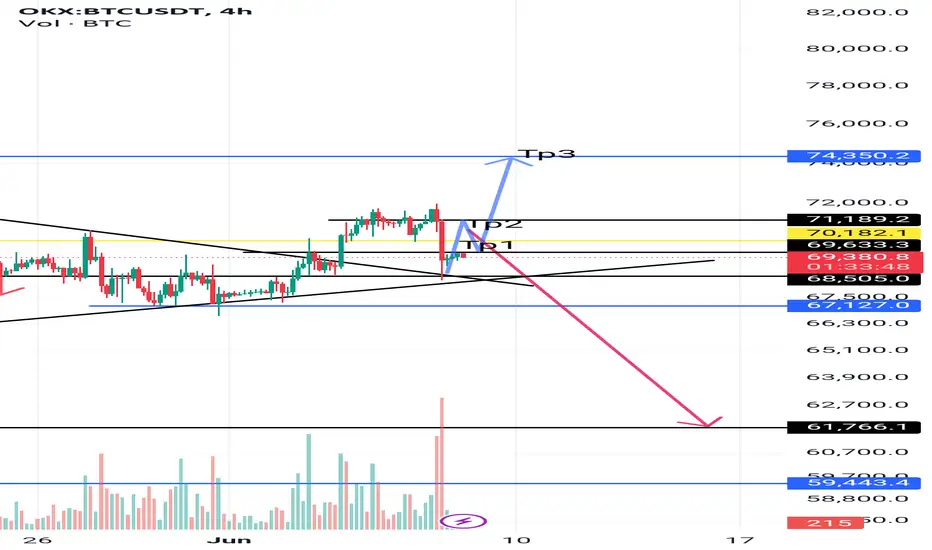
Btc4hBitcoin can climb from the current point to targets 1 and 2, and from there it must decide whether to break the ceiling or go down to 61,000.
BTC - ARE YOU READY TO GO BACK TO TITANIC IN 2023?BTC- Are you ready to go back to Titanic in 2023?
Ehsan.F

Long your longs dont listen to bearsAscending triangle + 1d rsi reset, there is a high chance this was one of the best opportunities you could get

BTC , they FAKE you and SHAKE you they BAKE you then TAKE you !Are you confused ? did you buy the break ? do yu have stops under support like a good boy ?
Broadening wedges are back. stop and liquidity hunts on both sides, H OS will be right below support and at BW trendline.
This is what professional actors look like on a chart.
They move from stops to stops l They trap "dumb" amateurs to grab their liquidity.
This is what professional actors look like on a chart :
If you are still trading with classic stuff taught in classic old school TA ( buy breaks , have stops under support levels ) .
You are getting confused and worse , chopped up.
So whats the PLAY ?
Well I sold into the break . Then I hedged short and I will go aggressive just under support for H OS in BTC . Prepare those orders as it might be fast.
Also I am accumulating a basket of ALT COINS: 25 currently and I will add size to my favourite ones if BTC break support .
LETS GO! And if you dont understand what I am talking about. just ask away. We have mastercourses for the uninitiated and you will become a good trader if you put in the time and discipline. otherwise , how do they say, keep your job at MACY dees ?
enjoy
sincerely Chris Chartman and the Freedom traders

BTC and CRYPTO , market whales and my DISTRO theory. My theory :
like I posted before the Flush my DISTRO theory is based upon following the “footprint” of whales.
I nailed the top because I imagine how a large group of whales running this market would accumulate and distribute their positions.
They team up, they run price above a level where they can trap bulls and stop out early shorts.
They want W M HL’s across ALTS . with the
least amount of work.
yeah . it def feels like they are setting up for another leg up.
if not they had runnit up above ATH , trap a load of amateurs, then distribute slowly into autum?
This is the way they get cheap prices over and over . especially in the ALTS!
Just think of ALL THE STOPS in those 2 D EQ lows! All of us early BULLS building positions and protecting them with stops under those lows.
Then:
they can just manipulate
BTC : and all the ALT ALGOS follow and then all they have to do is have millions of bids in all those ALTS below support. BAAM , now they have the M 2W HL’s in the whole Market.
then they start bidding it up. crowd follows - repeat !we will see how this unfolds.of course this could be a top . the DISTRO in Mai 2021 looked like this see chart below
quite a bit different. but a backside LH with a fakeout double top where they went short and stayed short over the summer. (bearbeitet)
I dont see those longer timeframe Wedge highs in BTC quite yet that would show some larger timeframe Distribution.

Bitcoin Weekly ChartSince the begining of March BTC has been consolidating in a range from approximately $60k to just over $70k. A year earlier BTC also entered a consolidation phase in March with the price of BTC ranging from about 25K to just over $30k.
The consolidation lasted about seven months with BTC finally breaking out in mid-October 2023. After exiting the consolidation the price of BTC more than doubled over the next five months.
It is impossible to know what the price of BTC will do in the short to medium term. However, if this current market cycle is going to have a similar timing as the previous two cycles (follow the 4-year cycle), then I believe it is possible for this consolidation to be very similar to the consolidation last year. If that happens then we would be looking at three or four more months of range bound consolidation with a breakout in the fall.
There are signs that this market cycle may have more in common with the 2011 to 2015 market cycle. The 2011 to 2015 cycle was accelerated compared to the next two cycle. The time it took for the price of BTC to surpass the previous all-time high was only 15 months (from the bear market bottom). Also, the cycle peak occurred only two years into the cycle, the next two cycle peaks were closer to year three of the cycle.
Looking at the current market cycle, the time it took the price of BTC to surpass the 2021 all-time high was 16 months, very close to the timing of the first cycle. If this current cycle timing does match the first cycle (2011 to 2015) then I would expect the price of BTC to peak in late fall of this year.

61000 btc before pump . double bottom ALL trading ideas have entry point + stop loss + take profit + Risk level.
hello Traders, here is the full analysis for this pair, let me know in the comment section below if you have any questions, the entry will be taken only if all rules of the strategies will be satisfied. I suggest you keep this pair on your watchlist and see if the rules of your strategy are satisfied. Please also refer to the Important Risk Notice linked below.
Disclaimer

BTC still Bullisch after correcting within channelBTC corrected but is it bearisch?
I don't think we have to be bearisch about this move. It looks like a stop loss hunt of the liquidity on de 68400 that was hit spot on.
The picked up liquidity could be the fuel for the Inverse Head and shoulders that is on the edge of breaking out.
More bullisch signals can be found on de daily chart in de Moving Avarages. The price bounced exactly at the 21EMA and that support is bullisch.
This weekend we will get more sideway movement. Can we break the neckline on monday and mak it support then we can look at technical targets around $68500 or more bullisch signals the would signal the Bullflag on the monthly chart. That technical target would be massive and touches the $ 106000.
But let us stay calm and take it step by step.

Bitcoin/TetherUSHello and respect to the honorable traders,
today we are examining the continuation of Bitcoin analysis. Previously, we mentioned that Bitcoin will experience an upward movement and then a pullback. According to Smart Money Concept analysis, this scenario is likely to be valid, and we are currently continuing the analysis. Bitcoin is likely to have a short pullback to the specified range and with the start of its downward trend, it will reach the $50,000 range.

BITCOIN - Price can continue move up to resistance levelHi guys, this is my overview for BTCUSDT, feel free to check it and write your feedback in comments👊
Recently price little declined and then bounced up to resistance level, which coincided with resistance area.
But then it started to decline inside pennant, where it fell to support line, breaking $67500 level.
After this BTC turned around and made strong upward impulse to $70300 points, exiting from pennant.
Then price continued to grow in wedge, where it broke $70700 level, but a not long time ago made downward impulse.
Bitcoin broke $70700 level and exited from wedge also, falling to $68300 points, after which it started to grow.
At the moment, I think BTC can little decline again and then continue to grow to $70700 resistance level.
If this post is useful to you, you can support me with like/boost and advice in comments❤️

BTC long setupALL trading ideas have entry point + stop loss + take profit + Risk level.
hello Traders, here is the full analysis for this pair, let me know in the comment section below if you have any questions, the entry will be taken only if all rules of the strategies will be satisfied. I suggest you keep this pair on your watchlist and see if the rules of your strategy are satisfied. Please also refer to the Important Risk Notice linked below.
Disclaimer

BTC price will go upHi the tradingview community! the BTCUSDT Analysis, as video analysis is ready to watch. plz go and watch in my youtube channel

BTCBTC mitigating Daily timeframe order block to moving upside. Next Bitcoin mitigate order block (3) to moving upside is high possible.
Order block (2) was sell side order block. So some downside correction possible. If the order block (2) was fail, bitcoin moving upside.
Bitcoin mitigating Daily timeframe order block. So the Trend reversal was high possible. But $62800 is best support zone. Maybe Bitcoin moving downside to touch the support to moving upside is high possible.

BTCUSDT (June 22)Hello my friends.
Bitcoin is in a support zone.
To enter the purchase transaction, you have to wait for the reversal pattern in the 1-hour time frame.

BTC/USDT weekly analysis on 22nd/Jun/2024Hi, crypto traders.
#Last week's results and review
Although I couldn't update the article last week, the price continued to decline as expected. 5MA has fallen below 20MA, 60MA, and 100MA, and the candlestick is below 5MA. I believe the price will continue to decline, but the focus will be on where it will rebound. In that case, the following target points may be helpful.
# Current order of the candlesticks and MA lines
the candle > 5MA (red) > 60MA (green) = 100MA (black) > 20MA (blue)
#Technical Positive Points
- If the candlestick rebounds and moves above all MAs, there is a possibility that an uptrend may resume.
#Technical Negative Points
- 5MA has fallen below all MAs and seems likely to continue declining.
- The slopes of 20MA, 60MA, and 100MA are all turning negative.
- 20MA is crossing 60MA and 100MA, forming a downtrend with 100MA > 60MA > 20MA > 5MA.
- Since the price is gradually declining rather than dropping sharply, there is a possibility of a sudden drop at some point.
#Trend forecast of this week : Short 70%
From a technical perspective, there are many very negative factors, so I expect the price to continue to decline. As noted below, the initial rebound target is 60,000 USD. However, if there is a sudden drop triggered by some event, it could fall below 60,000 USD and reach 56,500 USD. If you are aiming for the next upward timing, I recommend not entering during the first sudden drop but waiting for MAs to form a double bottom before entering a long position. I will continue to write articles and will mention the timing separately.
#Target points
If the price of Bitcoin increases
1st target: 65,900USD - 67,500USD (Cross-point with 60MA & 100MA & 20MA)
2nd target: 72,000USD (The highest price on 7th/Jun/2024)
3rd target: 73,800USD (The highest price on 14th/Mar/2024)
If the price of Bitcoin decreases
1st target: 60,000USD (A nice round price, the lowest price on 10th/May/2024)
2nd target: 56,500USD (The lowest price on 1st/May/2024)
3rd target: 50,000USD (A nice round number)
Let's enjoy trading this week too!

the price down to 63400from my analysis to data of bitcoin i can see the next trend of bitcoin will go down until 63400

BTC Bitcoin Technical Analysis and Trade Idea🔍 In this BTC Bitcoin analysis, we explore the higher time frame charts which currently indicate a bearish trend for Bitcoin. However, the price action on a 15m timeframe suggests a possible short term reversal. It's important to note that this is speculative and not a guaranteed forecast. It's prudent to watch for certain price movements to verify a genuine reversal. This video provides a close look at the trend, market structure, and price action. Remember, this content is for educational purposes only and trading carries significant risk. Always ensure you implement strong risk management strategies in your trading practices. 📈🔔

`De'ole Dogey BTC W@cckadoodleSee the chart. Those are the expected super-short-term targets. You won't have long to execute this. Good luck....

Trust me, 99% accurate internal signal!A lot of people message me every day and regret not joining me earlier, they get tormented in their daily trading, a lot of people lose all their money that they could have used to get more money, but they choose the wrong way, they think they can profit by themselves, but the end result is always surprisingly similar. Accounts were burned over and over again. So, if you still have money in your account and you want to recover all your losses and get more profits, you have to contact me. I guarantee you will work with me for 1-2 days and you will love this place forever. I guarantee that no other trader in my life can give you this feeling because it is the most authentic feedback. So don't let yourself live in regret and don't wait until you have lost everything and then contact me, then really no one can help you.

Bitcoin is due for a rally!Technical Analysis and Outlook:
Bitcoin hit our Inner Coin Dip of 64500 on the money and dipped to a lower target marked as Inner Coin Dip 63100. We anticipate a robust upward bounce from this point to reach the mean resistance level of 66500.

BTCUSD Bearish outlook for BTCUSD with a possible retracement upto previous resistance. BTC has mostly retraced upto previous resistance levels to liquidate long/short positions before making the next move. Entry and Key levels marked. Fib retracement is for reference. key level projected is marked with red line and labelled.
